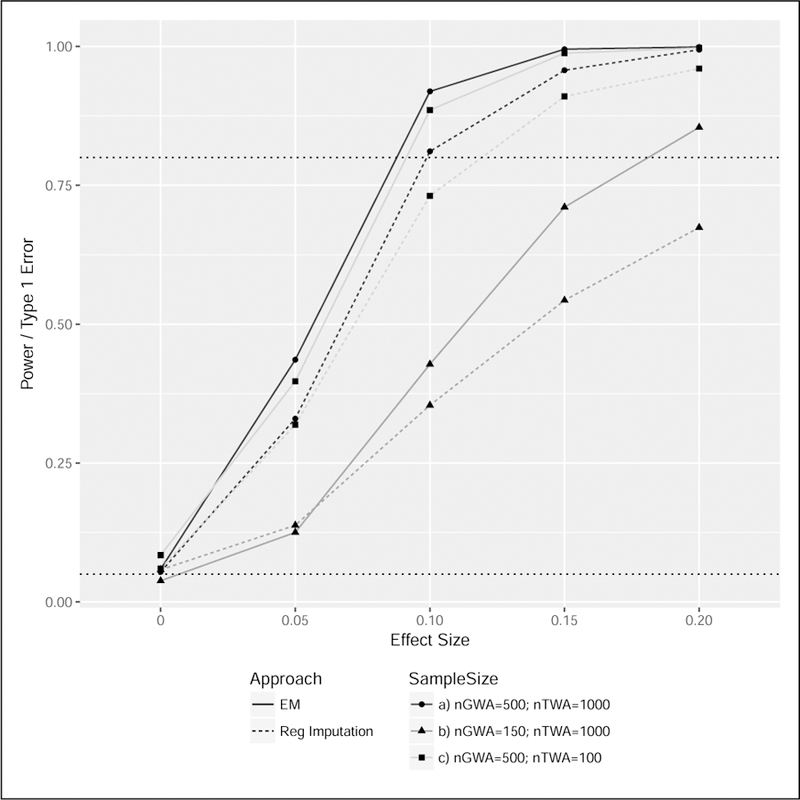
FIGURE 4. Power analysis for EM and regression imputation strategies.

Power and type-1 error rates are estimated based 1000 simulations and a significance threshold of 0.05. The black horizontal dotted lines have y-intercepts of 0.05 and 0.80. Assumed parameter values are β = 2.0, σ2 = 1.0, η = (1.0, 0.4, 0.4) and α = 1.2, where each of two SNPs are generated with a minor allele frequency of 0.20. Power of the EM approach is consistently higher than the regression imputation strategy. Similar to the unified likelihood approach described for normalized data, power increases substantially with increasing GWA sample size and is less impacted by TWA sample size.
