FIG 4.
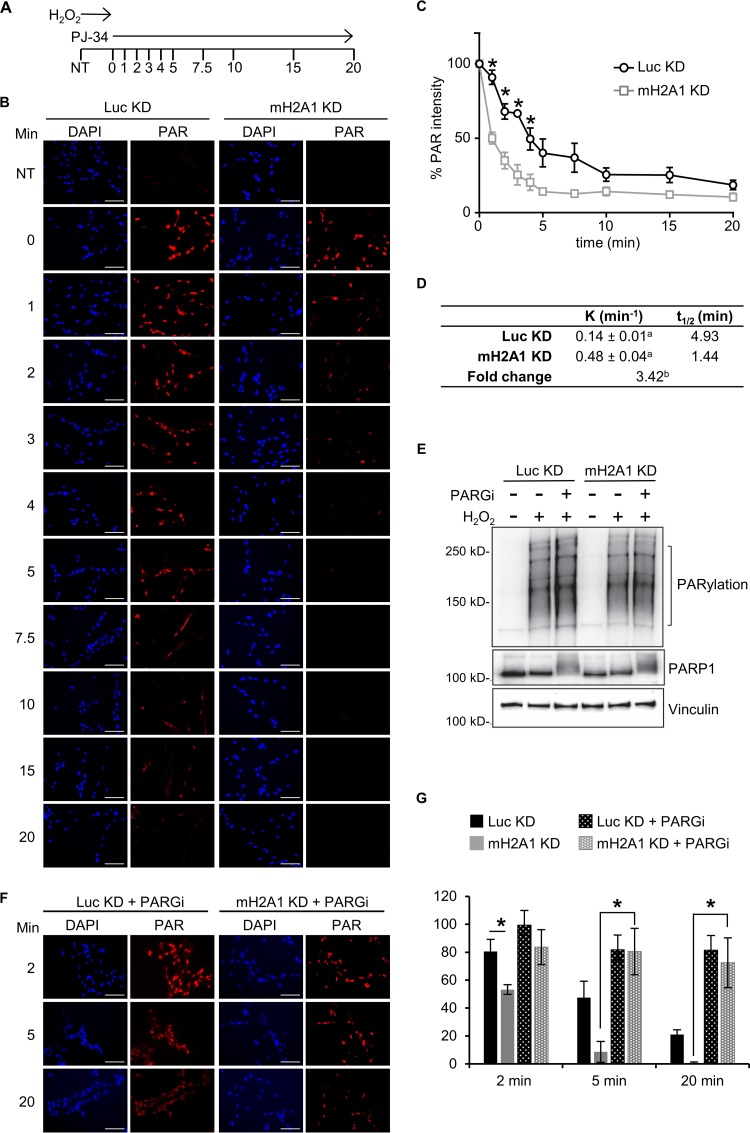
MacroH2A1 regulates PAR stability. (A) Schematic of PAR stability experiment. Cells were treated with H2O2 for 12 min to allow peak levels of PAR to accumulate; 10 μM PJ-34 was then added to prevent further PAR synthesis. PAR levels were monitored over the indicated time points (minutes). NT, not treated with H2O2. (B) Representative immunofluorescence images for the PAR stability assay described in the legend to panel A for IMR90 cells expressing shRNA against macroH2A1 (mH2A1 KD) or luciferase (Luc KD) as a control. Scale bars, 100 μm. (C) Average relative intensities of PAR staining for three independent experiments as described in the legend to panel A. The symbols and error bars represent means ± SEM. *, P < 0.05; Student's t test. (D) Rate constant (K) of PAR degradation and half-life (t1/2) of PAR in control (Luc KD) and macroH2A1-depleted (mH2A1 KD) cells. a, standard error of the rate constant; b, P < 0.0001 (F test). (E) Immunoblots for total cell lysates in control (Luc KD) or macroH2A1-depleted (mH2A1 KD) IMR90 cells for the indicated antibodies. The cells were treated with H2O2 for 12 min, in addition to 0.1 μM PARG inhibitor (PARGi) PDD00017273 where indicated. (F) Representative immunofluorescence images for the PAR stability assay described in the legend to panel A for control (Luc KD) and mH2A1-depleted (mH2A1 KD) IMR90 cells treated with 0.1 μM PARGi. (G) Average relative intensities of PAR staining for three independent experiments as described in the legend to panel F. The bars and error bars represent means ± SEM. *, P < 0.05; Student's t test.

