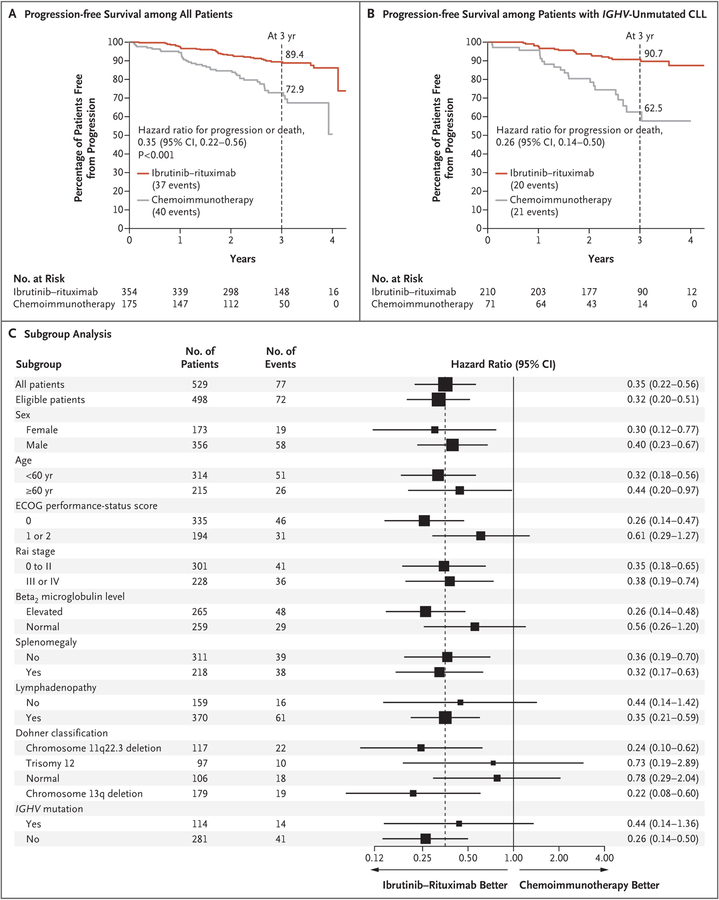
Figure 2. Primary and Subgroup Analyses of Progression-free Survival.
Panel A shows the Kaplan–Meier estimate of progression-free survival among all the patients who underwent randomization. Panel B shows the Kaplan–Meier estimate of progression-free survival among patients whose chronic lymphocytic leukemia (CLL) did not have the immunoglobulin heavy-chain variable region (IGHV) mutation. Panel C shows a forest plot of hazard ratios for progression or death, according to prognostic sub-groups of patients with CLL. The subgroup analysis was conducted in the intention-to-treat population. Hazard ratios (ibrutinib–rituximab vs. chemoimmunotherapy with fludarabine–cyclophosphamide–rituximab) were estimated with the use of univariable Cox proportional-hazards models stratified according to the four stratification factors. The size of the box is inversely proportional to the variance of the hazard ratio estimates. The dashed line indicates the overall hazard ratio among all patients who had undergone randomization. Eastern Cooperative Oncology Group (ECOG) performance-status scores are assessed on a 5-point scale, with higher scores indicating greater disability. Rai stages of disease range from 0 (low risk) to I or II (intermediate risk) to III or IV (high risk).

