
Fig. 3.
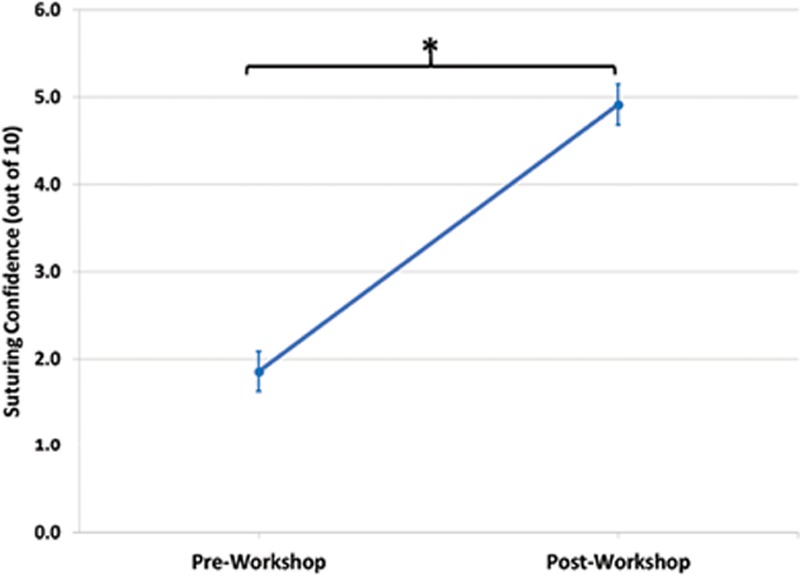
Changes in self-reported suturing confidence before and after attending the workshop. The dot represents the average value and the bars show the standard error of the mean. There was a significant increase in suturing confidence from pre- to post-workshop (P < 0.001, partial eta2 = 0. 695). *Statistical significance at P ≤ 0.001.