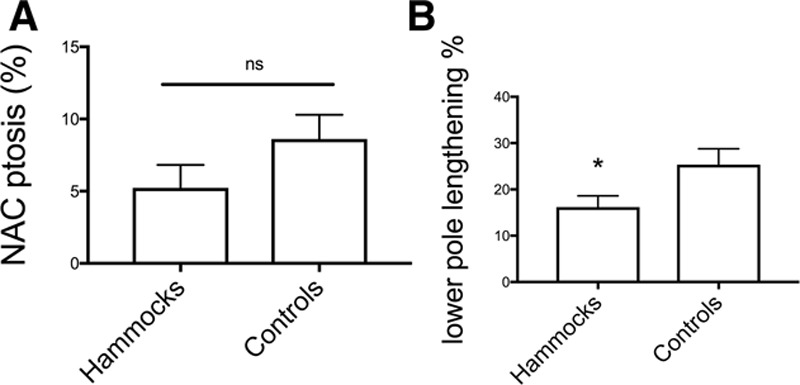
Fig. 4.

Comparison between Hammock technique and control technique. A, NAC ptosis percentage measured at 12 months in both the hammock and control groups. Values are expressed as average ± SEM. B, Lower pole lengthening percentage measured at 12 months in both the hammock and control groups. Values are expressed as average ± SEM (*P < 0.1). NS, no statistical significance
