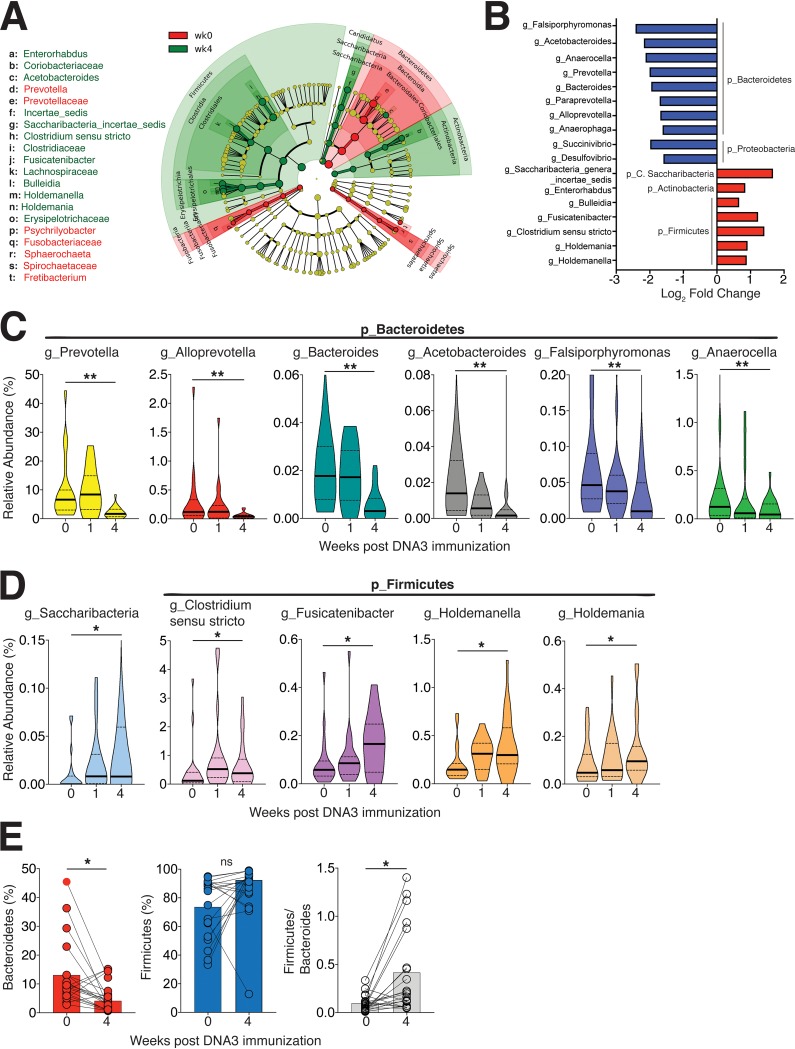
FIG 4.
Compositional plasticity in the rectal microbiome after HIV-1 DNA immunization. (A) Cladogram representing taxa significantly altered at week 4 after DNA3 immunization relative to week 0 by LEfSe analysis. Statistical analysis of taxa was performed using Limma-Voom differential expression package in R and genera with an adjusted P value of <0.05 were included in LEfSe analysis. (B) Top 10 downregulated (blue) and upregulated (red) genera at week 4 relative to week 0. (C and D) Violin plots show genera significantly decreased (C) and genera significantly increased (D) following DNA3 immunization. The thick black line indicates median, and the dashed lines show interquartile range. (E) Decrease in Bacteroidetes and increase in Firmicutes/Bacteroidetes ratio at week 4 relative to week 0 (P < 0.05, tested using the Mann-Whitney U test). Significance was tested by Spearman rank correlation test. ns, not significant.

