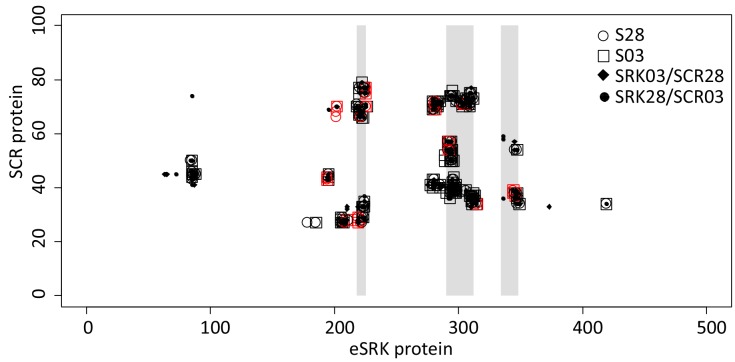
Figure 4. Map of atomic contacts from structural modelling of S03 and S28 complexes.
The X and Y axis represent the eSRK and SCR protein respectively. Open circles and squares represent amino acid contacts between eSRK and SCR proteins in cognate S03 and S28 complexes respectively. Red symbols represent SRK amino acids that differ between SRK03 and SRK28. Full diamonds and dots correspond to amino acid contacts in non-cognate SRK03/SCR28 and SRK28/SCR03 complexes respectively. Hypervariable regions 1, 2 and 3 of eSRK are represented by vertical grey bars at position 219–225, 290–312 and 334–348 respectively (Ma et al., 2016).

