. 2019 Nov 25;8:e50253. doi: 10.7554/eLife.50253

Figure 5. Four amino acid residues establish contrasted patterns of atomic contacts between SCR and SRK in the two cognate complexes.

In (A), residues R279 and W296 of eSRK establish a large number of atomic contacts with SCR in the S03 complex (upper panel), but a very low number of contacts in the S28 complex (lower panel). The situation is reversed in (B), where residues S201 and R220 of eSRK establish a large number of atomic contacts with SCR in the S28 complex (lower panel), but a very low number of contacts in the S03 complex (upper panel). SRK chains are coloured in light and dark green for SRK03 and SRK28, respectively; SCR chains are coloured in orange and red for SCR03 and SCR28, respectively. Amino acid residues are shown in stick representation, with dotted lines indicating atom pair contacts below 4 Å, excluding hydrogen atoms. Note that for clarity a more stringent threshold was used to define atomic contacts here (4 Å) than in Figure 5—figure supplement 1 and Figure 6—figure supplement 1 (where a 5 Å threshold was used for a more comprehensive analysis), but the results are qualitatively similar.

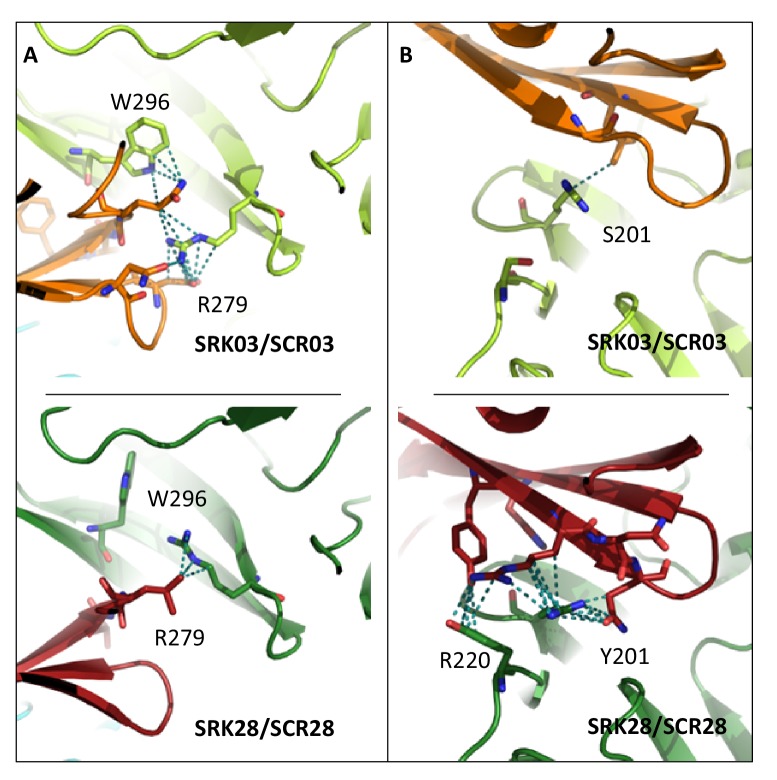
Figure 5.

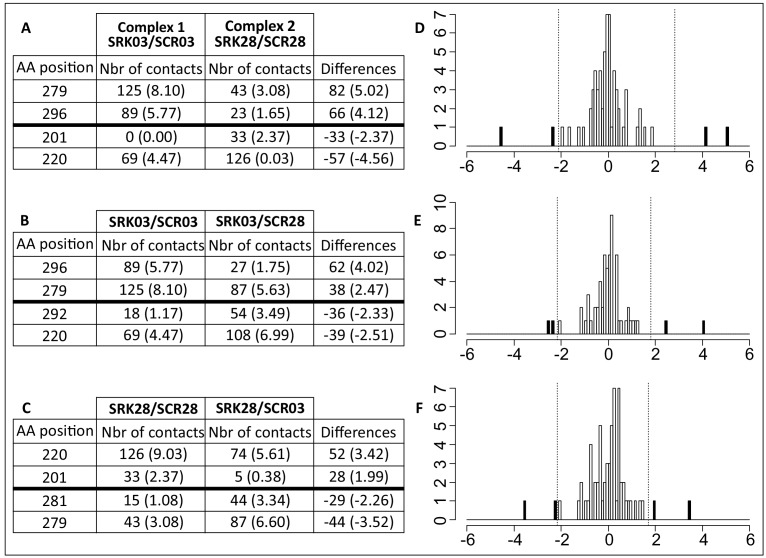
Figure 5—figure supplement 1. Comparison of amino acid contacts between the different SCR/SRK complexes points to amino acids of SRK potentially involved in specificity of ligand recognition.

Figure 5—figure supplement 1.

The number of atomic contacts between amino acids of the receptor and the ligand was compared between (A) the two cognate complexes (SCR03/SRK03 vs SCR28/SRK28); (B) the cognate vs non-cognate complex established by SRK03 (SCR03/SRK03 vs SCR28/SRK03) and (C) the cognate vs non-cognate complex established by SRK28 (SCR28/SRK28 vs SCR03/SRK28). The three tables list amino acid positions who establish the most extreme differences in atomic interactions in each comparison, values in parentheses correspond to the proportion of contacts realized by each aa independently ((number of contact in the complex/number of contact for one aa) x 100). The full distributions are shown in panels (D), (E) and (F) as the difference of proportion of contacts realized by each aa in both complexes. The vertical lines represent the 5% extreme values. Positive differences correspond to aa involved in numerous contacts in complex one compare to complex two whereas negative differences correspond to aa involved in numerous contact in complex two compare to complex 1.