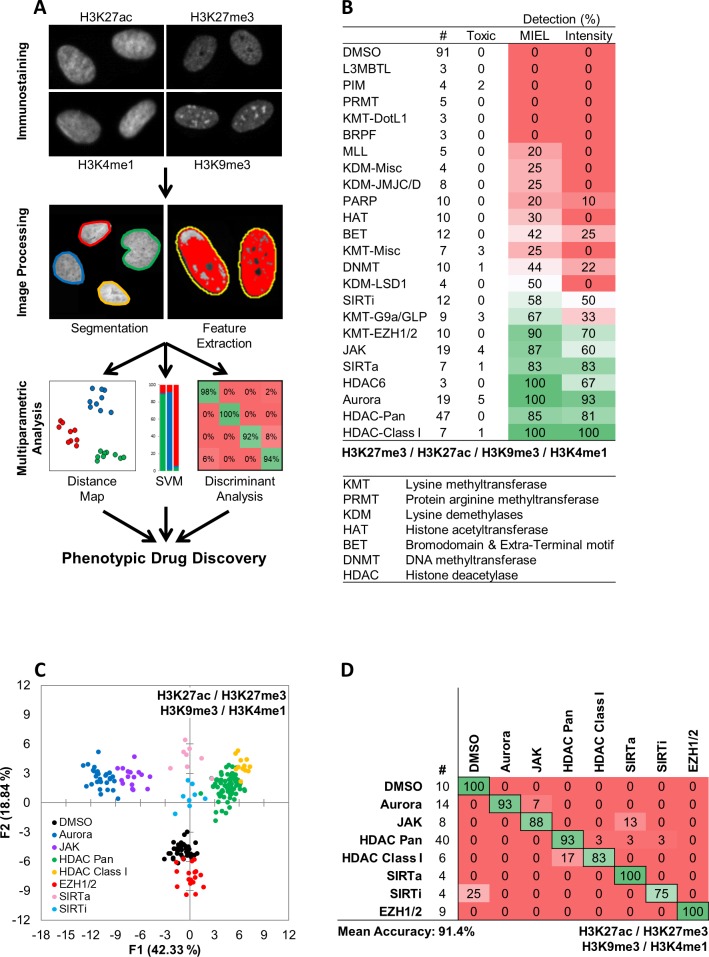
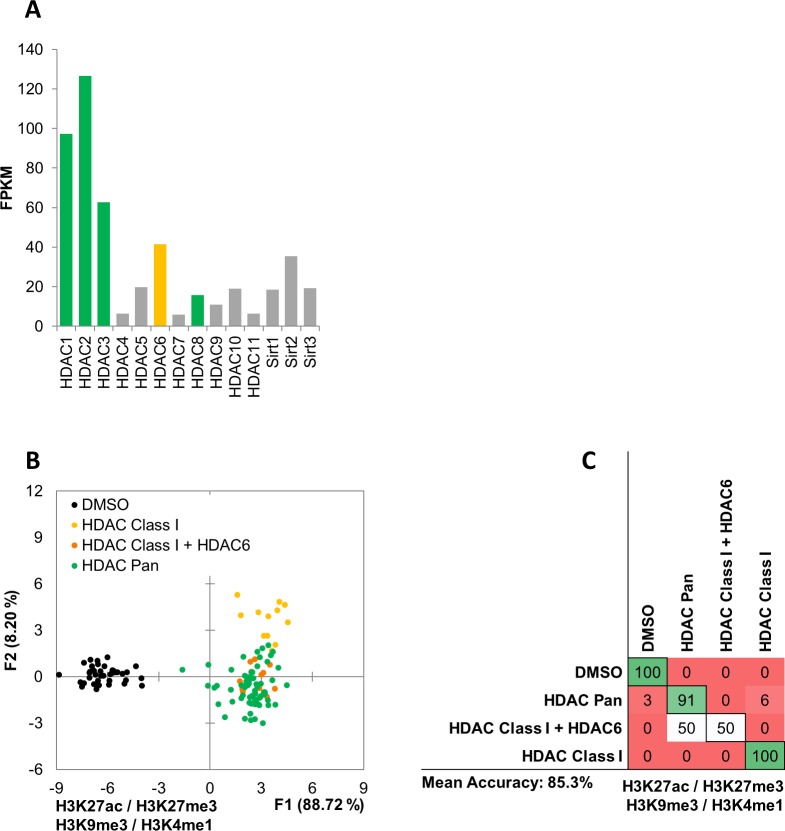
Figure 1. MIEL compares the epigenetic landscape of multiple cell populations and can be used to detect active epigenetic drugs across cell lines and drug concentrations.
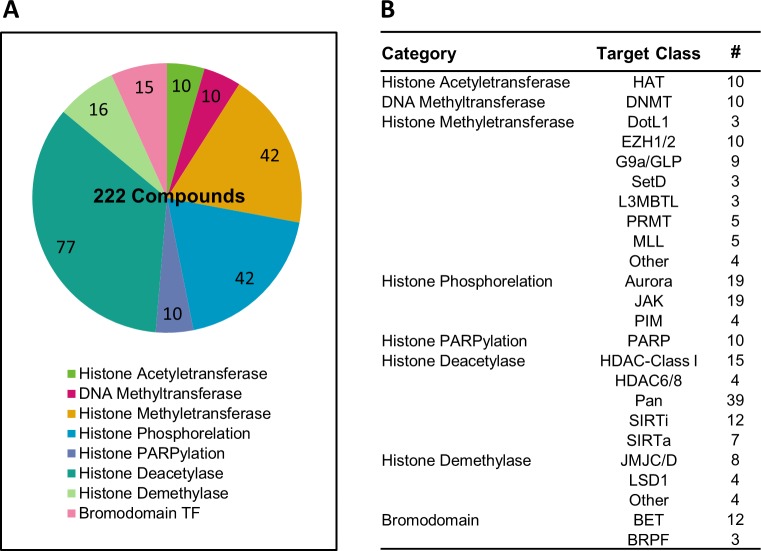
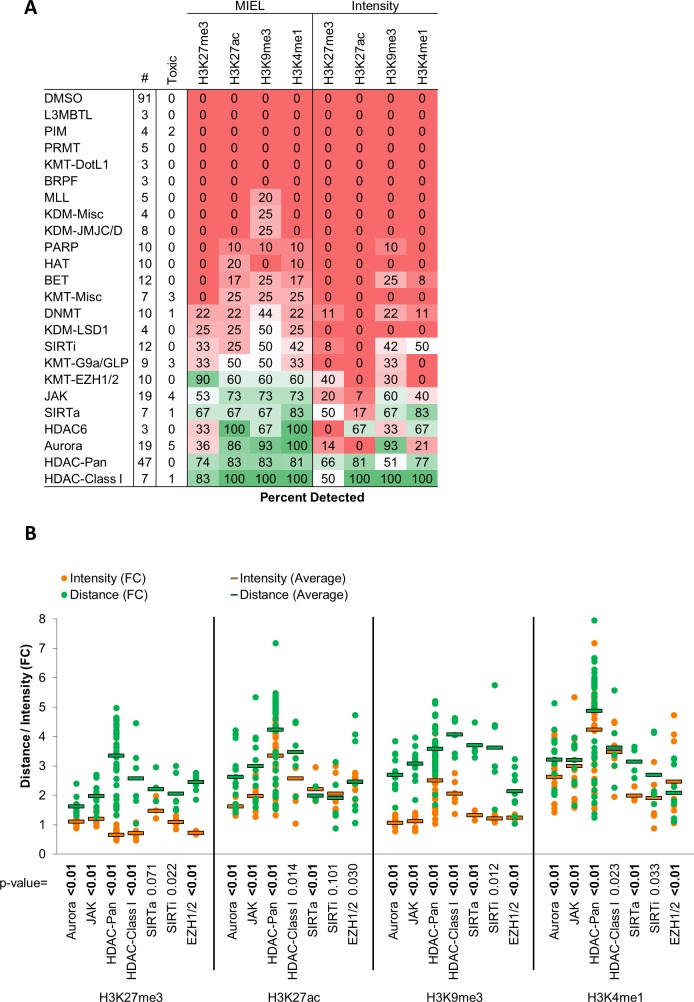
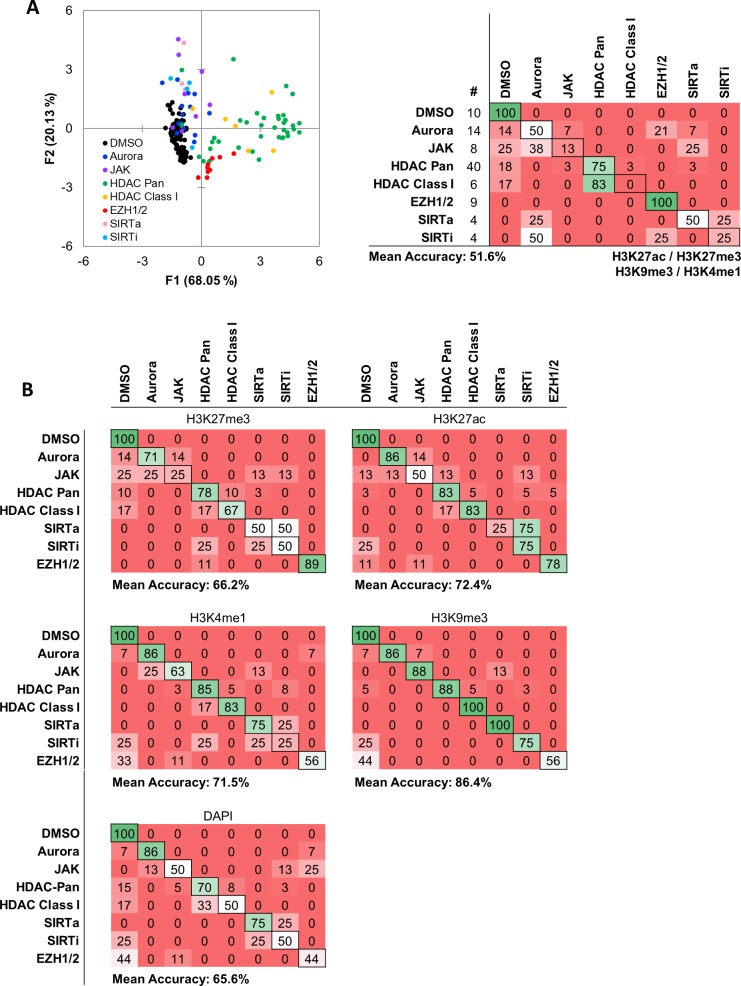
(A) Flowchart of MIEL pipeline. Fixed cells were immunostained for the desired epigenetic modifications and imaged. Nuclei were segmented based on DNA staining (Hoechst 33342 or DAPI) and texture features were calculated from the pattern of immunofluorescence. The relative similarity of multiple cell populations was assessed by calculating the multi-parametric Euclidean distance between populations centers, and represented in 2D following MDS (distance map). Discriminant analysis is used to functionally classify whole cell populations based on their multi-parametric centers. SVM classification is used to separate single cells in each population and estimate populations overlap. (B) Table showing the fraction of epigenetic drugs in each functional category identified as active by either MIEL analysis employing texture features derived from images of GBM2 cells stained for H3K9me3, H3K4me1, H3K27ac, H3K27me3, or by intensity-based analysis using the same modifications (see Materials and methods). (C,D) Quadratic discriminant analysis using texture features derived from images of GBM2 cells treated with either DMSO or 85 active compounds (two technical replicates per compound; 38 DMSO replicates) stained for H3K9me3, H3K27me3, H3K4me1, H3K27ac. (C) Scatter plots depicting the first two discriminant factors derived from features of all four histone modification images for each cell population. (D) Confusion matrix showing classification results of discriminant analysis. Left column details number of compounds or DMSO replicates for each category in the test set (one replicate per compound). Numbers represent the percent of compounds classified correctly (diagonal) and incorrectly (off the diagonal).

