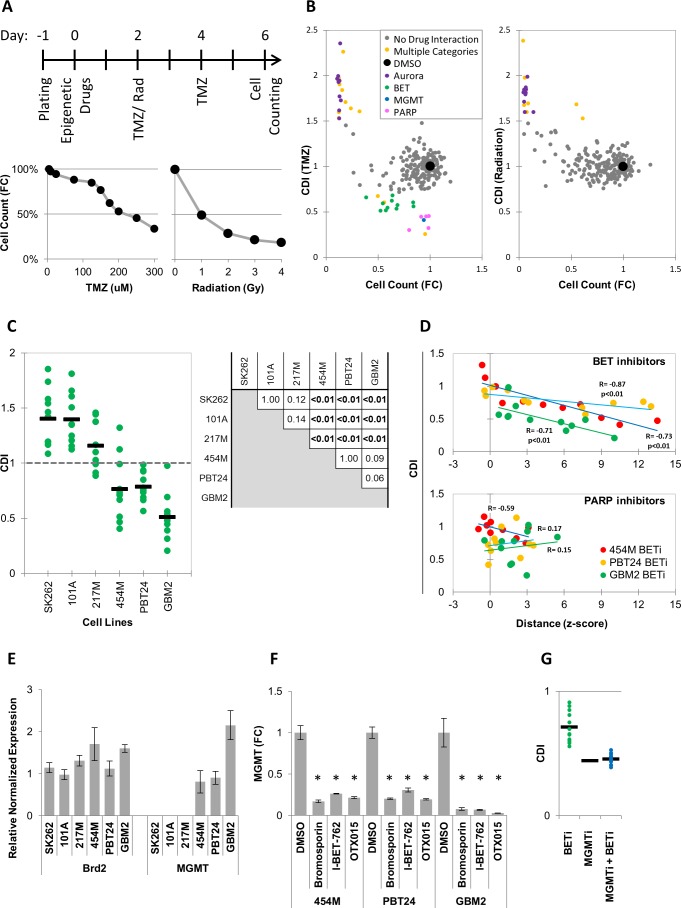
Figure 3. MIEL can be used to rank candidate drugs by activity.
(A) Top: Scheme describing the experimental setup used to identify synergy between epigenetic drugs and radiation or TMZ. Bottom: Scatter plots showing the fold reduction in GBM2 cell count following a 4 day treatment with varying TMZ concentration and radiation doses. (B) Scatter plots showing fold change in cell count (compared to DMSO treated cells) and coefficient of drug interaction (CDI) for synergy with TMZ (left) and radiation (right) for each drug (n = 222, values represent the average of 3 technical replicates). (C) Graph showing individual and average CDI for BET inhibitors in 6 GBM lines (n = 11 drugs, average of 3 technical replicates; p-values calculated by ANOVA using Tukey’s HSD for multiple comparisons between lines and shown in table). (D) Scatter plot showing the correlation between CDI and MIEL-derived activity (z-scored Euclidean distance from DMSO) of BET and PARP inhibitors (nBETi = 11; nPARPi = 10; values represent the average of 3 technical replicates) in 3 GBM lines (454M, PBT24, GBM2). (E) Bar graph showing the relative normalized expression of Brd2 and MGMT in 6 GBM lines as measured by qPCR (Mean ± SD; n = 3 technical repeats). (F) Bar graph showing fold reduction in MGMT expression following treatment with BET inhibitors in three different GBM lines as measured by qPCR (Mean ± SD; n = 3 technical repeats). (G) Graph showing individual and average TMZ sensitization CDI for BETi, MGMTi (Lomeguatrib) and BETi and MGMTi in GBM2 cells (n = 11 drugs, values represent the average of 3 technical replicates).


