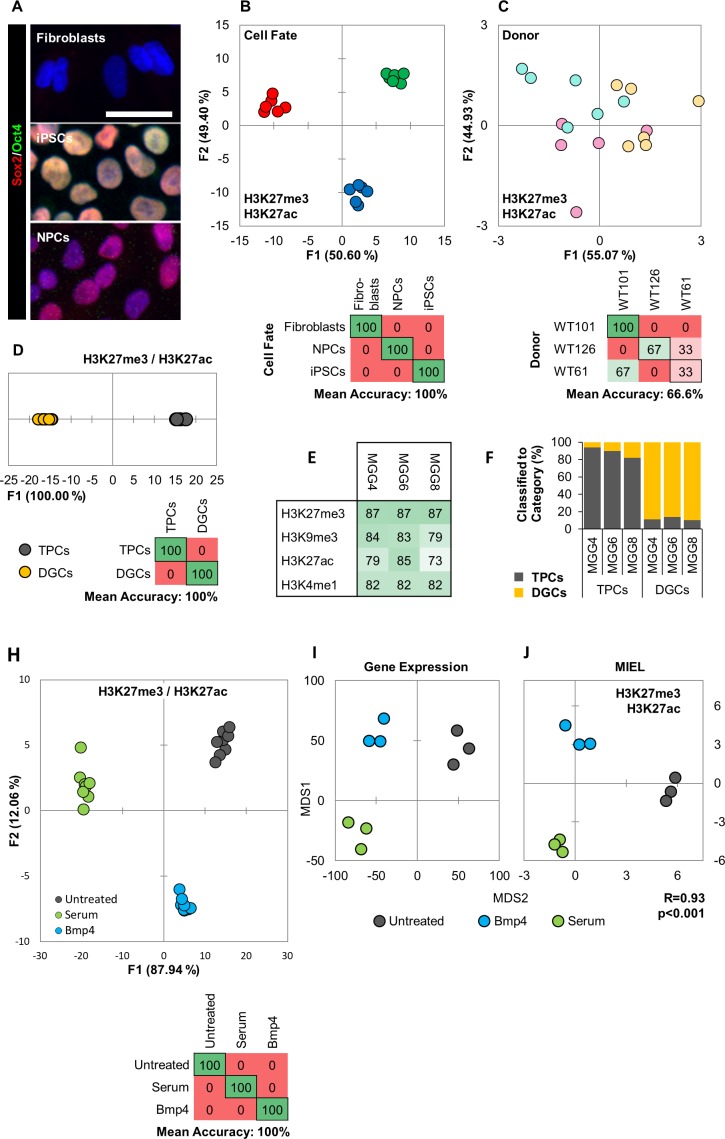
Figure 4. MIEL can distinguish between cell fates and identify glioblastoma differentiation.
(A) Hoechst 33342 stained (blue), and Sox2 (red) and Oct4 (green) immunofluorescence labeled fibroblasts (Sox2-/Oct4-), iPSCs (Sox2+/Oct4+) and NPCs (Sox2+/Oct4-). Scale bar, 50 µm. (B, C) Quadratic discriminant analysis separating either cell fates or cell lines using texture features derived from images of fibroblasts, iPSCs, and NPCs lines from three human donors (WT-61, WT-101 and WT-126; three technical replicates each); stained for H3K9me3 and H3K4me1. (B) Discriminant analysis separating the different cell types. Scatter plot depicting the first two discriminant factors for each cell population (two replicate per cell line and cell type). Confusion matrixes showing classification results for discriminant analysis (test set: one replicate per cell line and cell type) Numbers represent the percent of correctly (diagonal) and incorrectly (off the diagonal) classified cell populations. (C) Discriminant analysis attempting to separate different cell lines. Scatter plot depicting the first two discriminant factors for each cell population (two replicates per cell line and cell type). Confusion matrixes showing classification results for discriminant analysis (test set: one replicate per cell line and cell type). Numbers represent the percent of correctly (diagonal) and incorrectly (off the diagonal) classified cell populations. (D, E, F) TPC and DGC cell lines derived simultaneously from tumors of 3 human donors (MGG4, MGG6, MGG8; three technical replicates each); stained for H3K9me3, H3K4me1. (D) Quadratic discriminant analysis separating TPCs and DGCs using image texture features. Scatter plot depicting the first discriminant factor for each cell population (two replicates per cell line). Confusion matrix showing classification results for discriminant analysis (test set: one replicate per cell line). Numbers represent the percent of correctly (diagonal) and incorrectly (off the diagonal) classified cell populations. (E) Pairwise classification of single TPC and DGC cells using an SVM classifier trained on texture features derived from images of H3K27me3, H3K9me3, H3K27ac, or H3K4me1. Numbers correspond to the percent of correctly classified cells for each line using indicated epigenetic marks. (F) Bar graph showing results of SVM classification for single TPC and DGC cells using a classifier trained on texture features derived from images of H3K27ac and H3K27me3 marks in the MGG4 line. (H) Quadratic discriminant analysis using texture features derived from images of untreated or 2 days serum or Bmp4 treated GBM2, 101A, SK262 and 454 M cells (three replicates per cell lines per treatment) and stained for H3K9me3, H3K4me1. Scatter plot depicting the first two discriminant factors for each cell population (two replicates per cell lines per treatment). Confusion matrix showing classification results for discriminant analysis (test set: one replicate per cell line per treatment). Numbers represent the percent of correctly (diagonal) and incorrectly (off the diagonal) classified cell populations. (I) Distance map depicting the relative Euclidean distance between the transcriptomic profiles of DMSO-, Bmp4- and serum-treated GBM2 cells calculated using FPKM values of all expressed genes (14,376 genes; FPKM > 1 in at least one sample). Each treatment in triplicates. (J) Distance map depicting the relative Euclidean distance between the multiparametric centroids of DMSO-, Bmp4- and serum-treated GBM2 cells calculated using texture features derived from images of H3K27ac and H3K27me3 marks. Each treatment in triplicates. R denotes Pearson correlation coefficient.
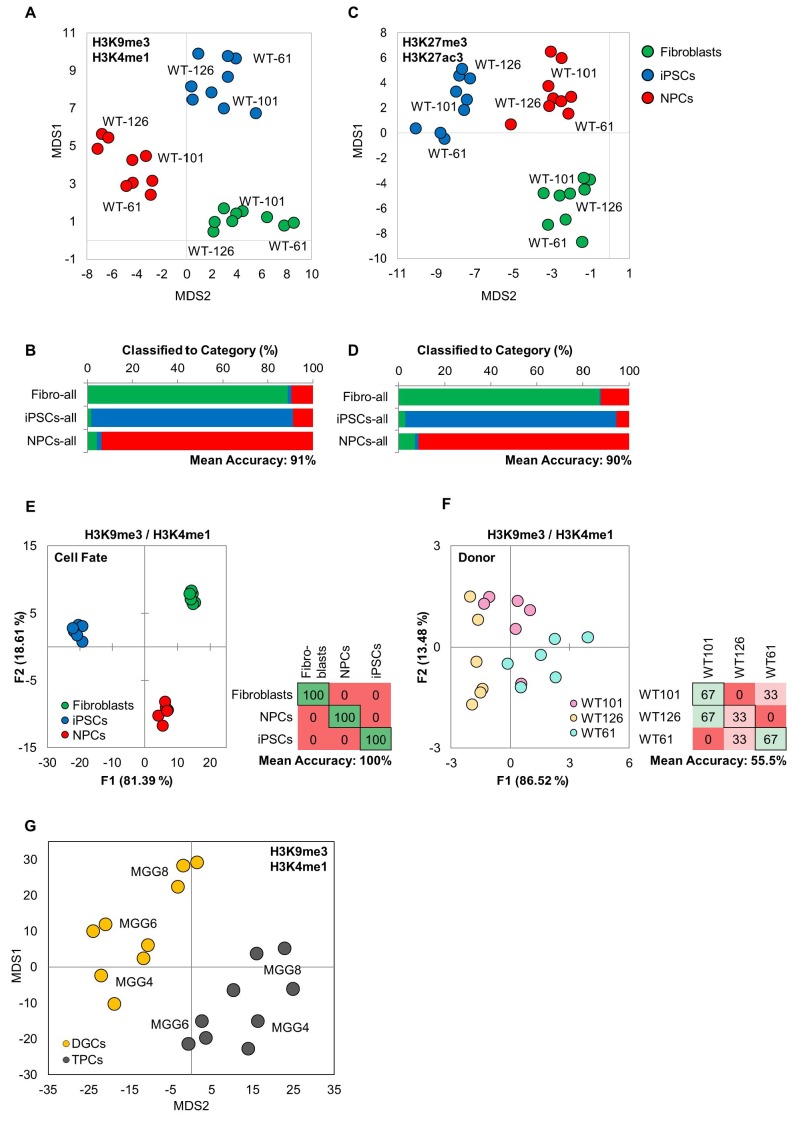
Figure 4—figure supplement 1. MIEL can distinguish between multiple cell fates.
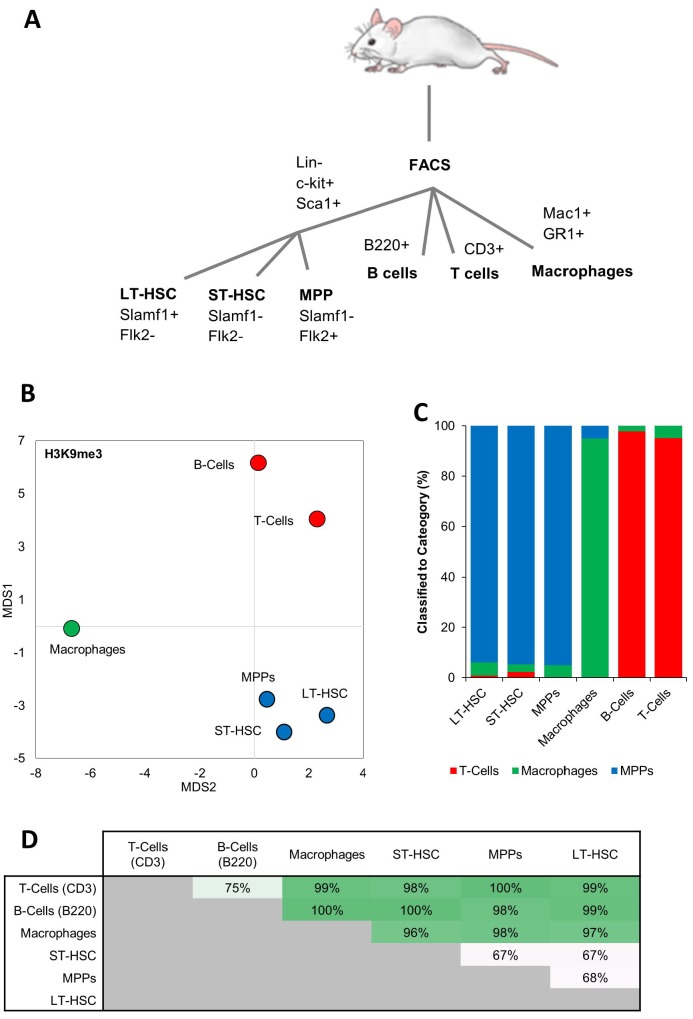
Figure 4—figure supplement 2. MIEL can distinguish between cells from different hematopoietic lineages.
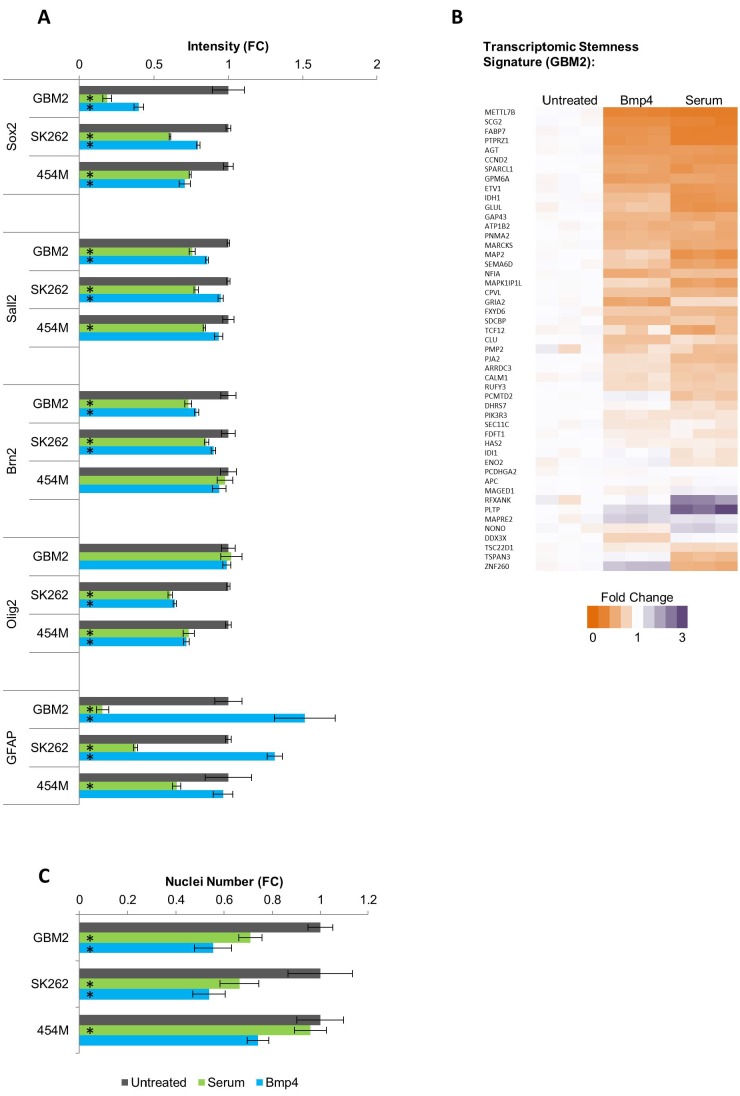
Figure 4—figure supplement 3. Serum and Bmp4 reduce expression of genes associated with undifferentiated glioblastoma TPCs.
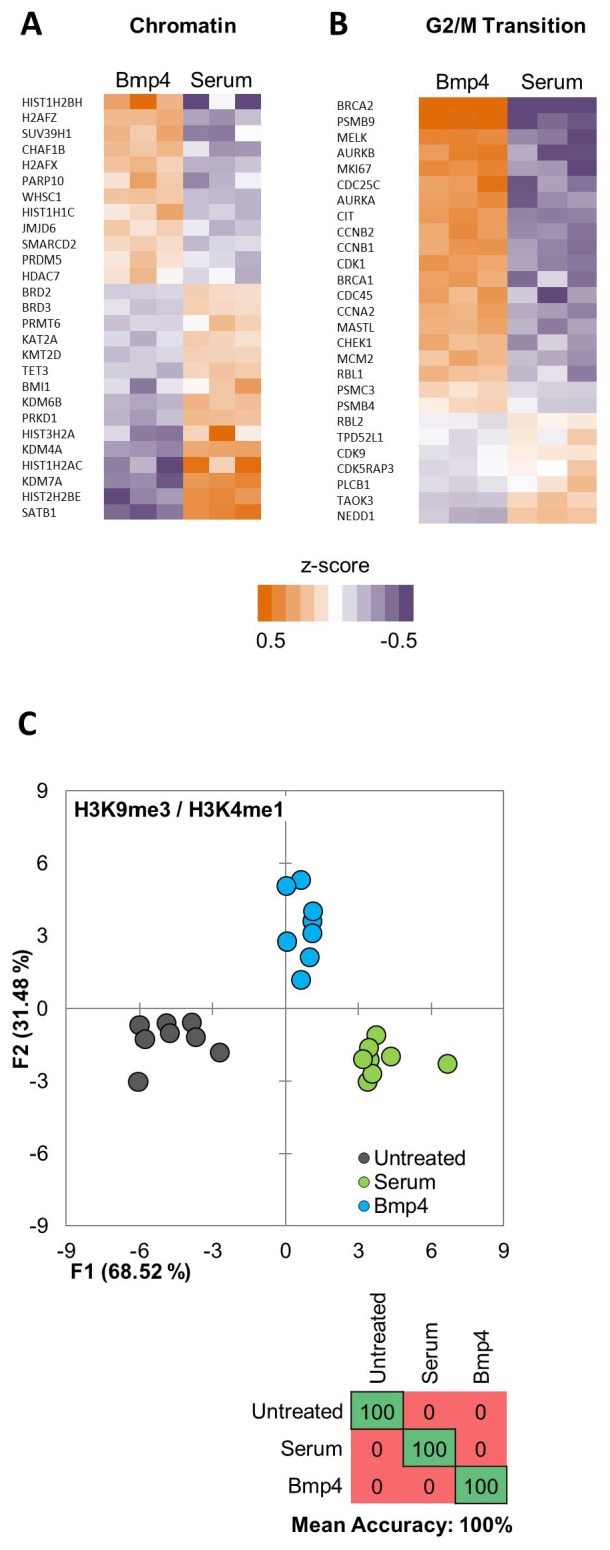
Figure 4—figure supplement 5. Serum and Bmp4 treatments induce distinct epigenetic and transcriptomic changes.
