. 2019 Oct 22;8:e49683. doi: 10.7554/eLife.49683

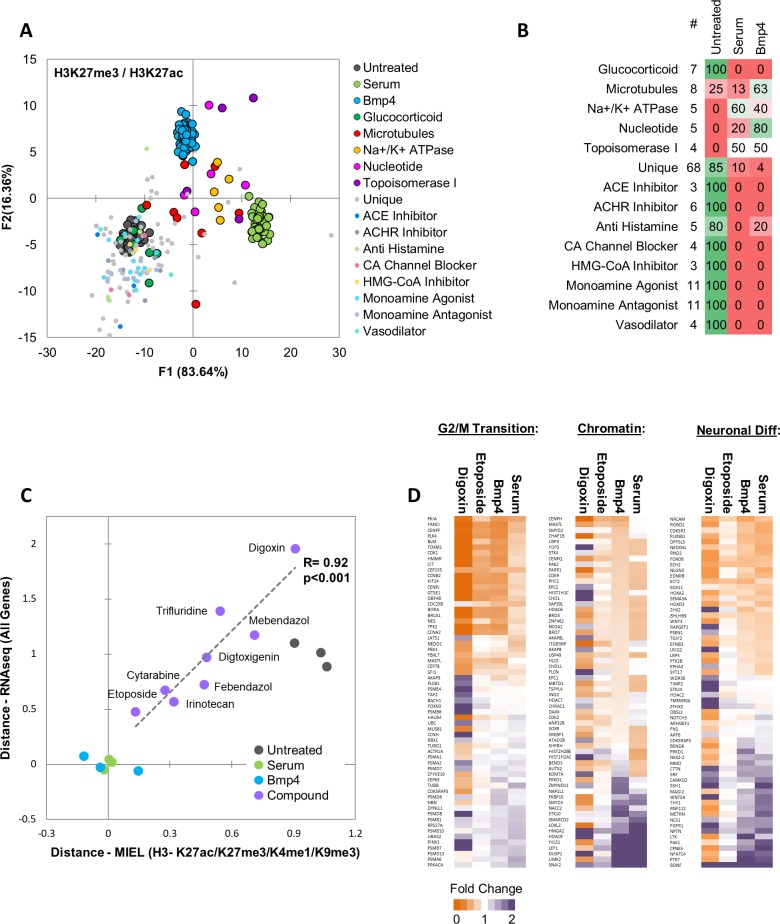
Figure 5. MIEL prioritizes small molecules based on serum/Bmp4 differentiation signature.

Quadratic discriminant analysis using texture features derived from images of untreated, serum-, Bmp4- and compound-treated GBM2 cells stained for H3K27me3, H3K27ac. Model was built to separate untreated, serum- and Bmp4-treated cells (60 technical replicates each). (A) Scatter plot depicting the first two discriminant factors for each population. (B) Confusion matrix showing classification of epigenetically active Prestwick compounds. Numbers depict the percent of compounds from each category classified as either untreated, serum or Bmp4 treated. (C) Scatter plot showing the correlation of gene expression profile-based ranking and MIEL-based ranking for eight candidate drugs, untreated, serum- or Bmp4-treated GBM2 cells. Euclidean distance to serum- or Bmp4-treated GBM2 cells was calculated using transcriptomic profiles (vertical axis) or texture features derived from images of H3K27ac and H3K27me3, H3K9me3, and H3K4me1 marks (horizontal axis). Distances were normalized to untreated and serum- or Bmp4-treated GBM2 cells. (D) Heat maps showing fold change in expression of select genes taken from the Gene Ontology (GO) list: cell cycle G2/M phase transition (GO:0044839), chromatin modification (GO:0006325), and regulation of neuron differentiation (GO:0045664). R denotes Pearson correlation coefficient. Drug concentrations a-c: febendazole = 0.5 µM, mebendazole = 0.5 µM, cytarabine = 0.3 µM, trifluridine = 3 µM, irinotecan = 0.5 µM, etoposide = 0.3 µM, digitoxigenin = 0.3 µM, digoxin = 0.3 µM.

Figure 5.

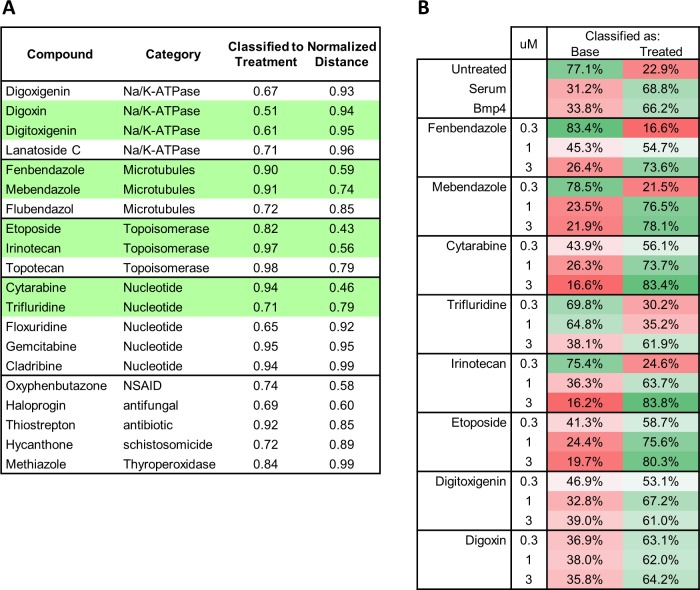
Figure 5—figure supplement 1. Functional categories of drugs prioritized by MIEL from the Prestwick library.

Figure 5—figure supplement 1.

(A) Twenty hit compounds grouped by the functional classes. For the pairwise classification, the classifier was trained on texture features derived from H3K27ac and H3K27me3 images of serum- or Bmp4-treated GBM2 (vs untreated; cut off = classified to treatment >50%). Normalized distance calculated as the Euclidean distance of a compound to either serum or Bmp4 (the smaller of the two) divided by the distance of untreated cells to the same control (cutoff = normalized distance <1). (B) Table showing pairwise classification of indicated drug-treated GBM2 using a classifier trained on texture features derived from H3K27ac and H3K27me3 images of DMSO- and either serum- or Bmp4-treated GBM2 cells.
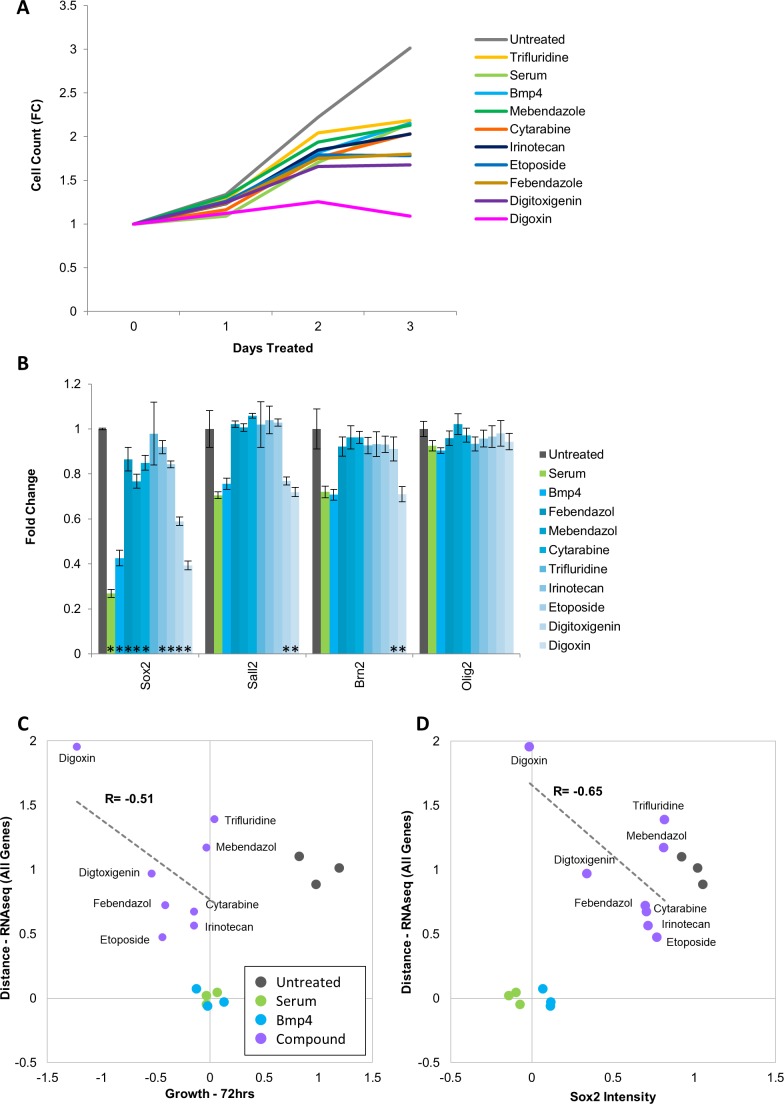
Figure 5—figure supplement 2. Drugs identified in screen lower proliferation rate of Glioblastoma cells but do not induce down regulation of key transcription factors.

Figure 5—figure supplement 2.

(A) Growth dynamics (fold change in cell count – vertical axis) of untreated, serum-, Bmp4- or drug-treated GBM2 cells over 3 days. (B) Fold change in Sox2, Sall2, Brn2, and Olig2 immunofluorescence intensity of untreated or serum-, Bmp4- or drug-treated GBM2 cells; 3 days of treatment (mean ± S.D, n = 3, p<0.05, unpaired two-tailed t-test). (C) Scatter plot showing the correlation of gene expression profile-based ranking and growth rates for untreated, serum-treated, Bmp4-treated, or 8-drugs-treated GBM2 cells. Euclidean distance to serum- or Bmp4-treated GBM2 cells was calculated using transcriptomic profiles (vertical axis), or growth rate after 72 hr treatment with immunofluorescence intensity (horizontal axis). Distances and growth rates were normalized to untreated and serum- or Bmp4-treated GBM2 cells. R denotes Pearson correlation coefficient. (D) Scatter plot showing the correlation of gene expression profile-based ranking and Sox2 expression for eight candidate drugs, untreated, serum- or Bmp4-treated GBM2 cells. Euclidean distance to serum- or Bmp4-treated GBM2 cells was calculated using transcriptomic profiles (vertical axis), or Sox2 immunofluorescence intensity (horizontal axis). Distances and Sox2 levels were normalized to untreated and serum- Bmp4-treated GBM2 cells.