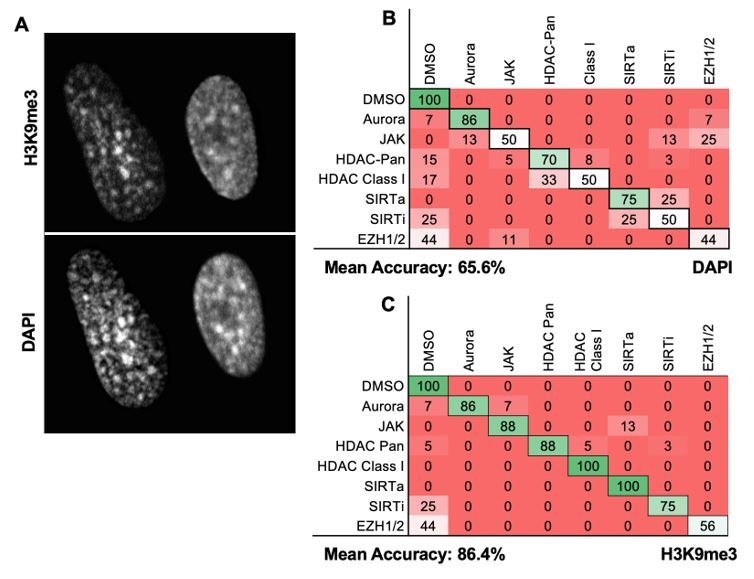
Author response image 4. DAPI images can be used for MIEL analysis.

(A) Image of DAPI-stained GBM2 cells demonstrating the similarities in DAPI and H3K9me3 staining (contrast and brightness adjusted to highlight similarity of stain). (B, C) Quadratic discriminant analysis using texture features derived from images of GBM2 cells treated with DMSO or 85 active compounds (2 technical replicates per compound; 38 DMSO replicates) stained for (B) DAPI or (C) H3K9me3 (reproduced from manuscript Figure 1—figure supplement 3B). Confusion matrices show classification results from discriminant analysis. Numbers represent the percentage compounds classified correctly (diagonal) and incorrectly (off diagonal).
