. 2019 Dec 12;8:e50749. doi: 10.7554/eLife.50749

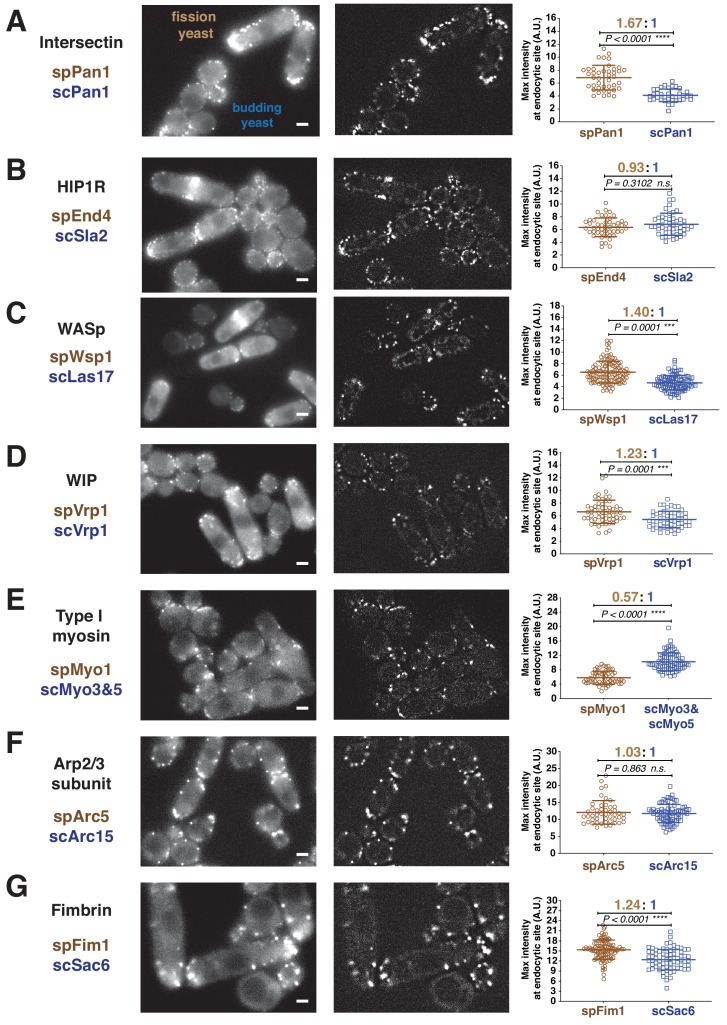
Figure 1. Quantitative side-by-side comparison of levels of homologous proteins at endocytic sites in budding and fission yeast.

Single frames from unprocessed (left panel) and processed (middle panel) movies for particle intensity quantification, and average maximum intensity of indicated proteins at endocytic sites (right panel). (A-G) Indicated endocytic protein homologues were tagged with GFP or mEGFP in budding yeast or fission yeast, respectively, at the endogenous loci. The maximum intensity for each tagged protein was determined from particle tracking data (see Figure 1—figure supplement 3 for details). mEGFP signal is 14% brighter than GFP (Coffman et al., 2011). The brightness difference was corrected throughout the data analysis. For most indicated proteins, at least 50 endocytic sites were examined. n.s. stands for ‘not significant’. Scale bars on the cell images are 2 µm.

Figure 1—source data 1. Figure 1A-G maximum intensity source data.

Figure 1.

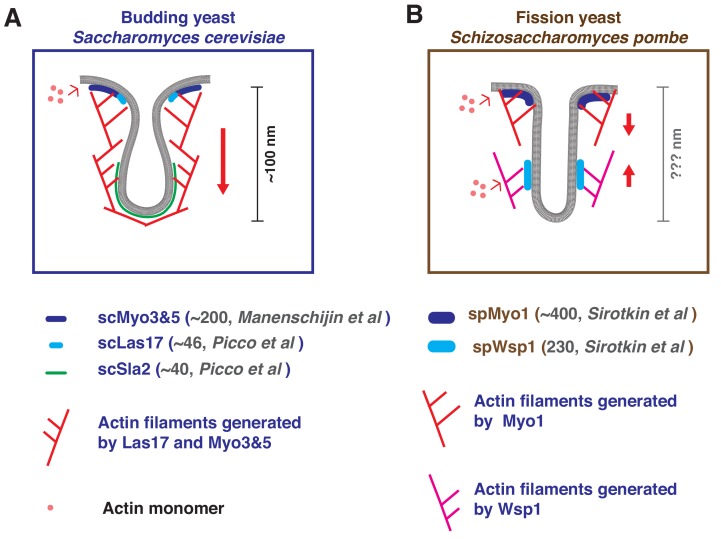
Figure 1—figure supplement 1. Endocytic sites in budding and fission yeast: A brief summary of what has been reported previously.

Figure 1—figure supplement 1.

The endocytic actin machinery on invaginated membranes in budding (A) or fission (B) yeast. (A) In budding yeast, actin filaments are proposed to be nucleated near the base of the invagination. Continued polymerization driven by the nucleation promoting activity (NPF) of scMyo3/5 and scLas17 pushes the actin network toward cytoplasm (Sun et al., 2006). The endocytic membrane is coupled to the actin network by coat proteins such as Sla2 and is pulled inward with the actin network (Kaksonen et al., 2003; Sun et al., 2005). The membrane invagination is ~100 nm deep at the time of vesicle scission (Kukulski et al., 2012). Previously, HA-tagged Myo5 was observed not only at the base but also at the tip of endocytic membrane invaginations in chemically fixed budding yeast cells by immunoelectron microscopy (Idrissi et al., 2008; Idrissi et al., 2012). These results led to the proposal that two distinct endocytic actin networks exist in budding yeast. However, two independent live-cell imaging studies indicated that Myo5-GFP patches stay non-motile at the cell cortex during their lifetime (Galletta et al., 2008; Sun et al., 2006). Furthermore, super-resolution microscopy suggested that Myo5-GFP forms a Nano-template for actin nucleation at the membrane base (Mund et al., 2018). Together, these observations suggest that most if not all of the type I myosin is localized at the base of invaginated endocytic membranes. (B) In fission yeast, a two-zone model proposes that actin nucleation by spMyo1 and spWsp1generate two independent actin networks that push against each other and pull the tip of the invagination into the cytoplasm (Arasada and Pollard, 2011). The depth of the fission yeast membrane invagination is not clear. Note, some of the previously measured absolute molecular numbers of indicated protein homologues differ greatly between the two yeasts (Manenschijn et al., 2019; Picco et al., 2015; Sirotkin et al., 2010).
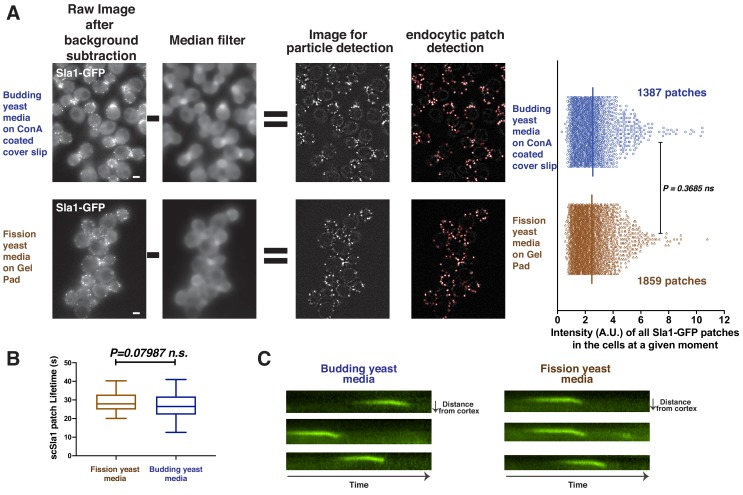
Figure 1—figure supplement 2. Quantitative comparison of fluorescently-tagged scSla1 in budding yeast cultured in different media.

Figure 1—figure supplement 2.

(A) Budding yeast expressing Sla1-GFP were cultured in budding yeast (upper panel) or fission yeast (lower panel) media. The cells were then imaged by the Materials and methods commonly used for budding or fission yeast, respectively. The images were processed and analyzed using the Particle Tracker plugin in ImageJ software (see Materials and methods). To precisely compare the number of endocytic proteins at endocytic sites under these different growth conditions, local background correction by median filter subtraction (Picco and Kaksonen, 2017) was applied to the live cell images after general background subtraction and photobleaching correction. Red circles in right panels indicate the endocytic events automatically detected by the tracking program. The fluorescence intensities of all the detected events were measured and compared. Scale bars are 2 µm. (B) Lifetime of scSla1 patches in different media. (C) Radial kymograph of scSla1 patches in different media.
Figure 1—figure supplement 3. Live cell imaging data processing and analysis by Particle Tracker plugin.

Figure 1—figure supplement 3.

(A) Single frame from movie processed for background subtraction and photobleaching correction (left panel). A median filter was used to compute the local background surrounding the endocytic patches (middle panel). The median filtered image was subtracted from the processed image, resulting in the image (right panel) for particle tracking. (B) Time series showing intensity and movement of a single endocytic event over its full lifetime using Particle Tracker. (C) The. csv file generated by particle tracking analysis. Scale bars are 2 µm.