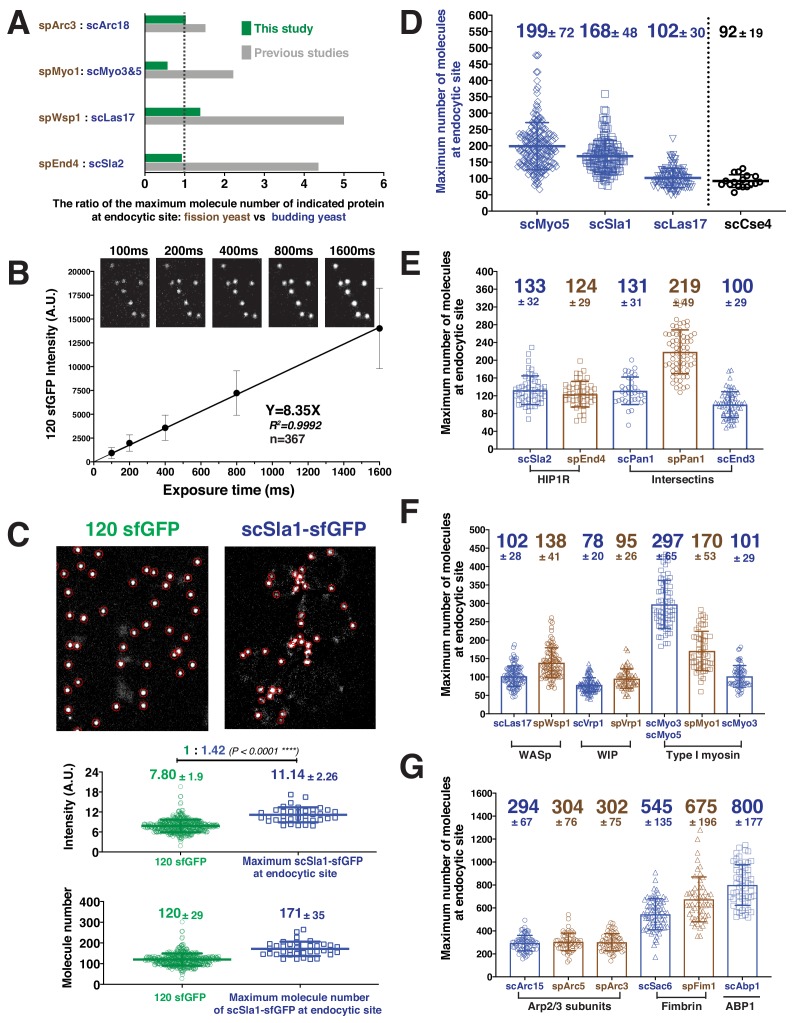
Figure 2. Determining the maximum number of fluorescently-tagged endocytic proteins at endocytic sties by ratiometric comparison of fluorescence intensities to the intensity of 120-sfGFP-tagged nanocages.
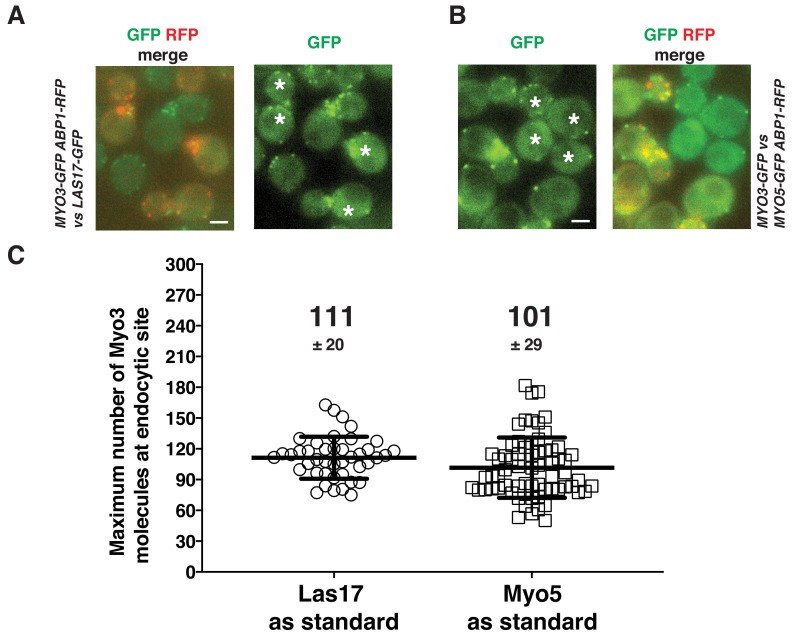
(A) Comparison of ratios of maximum protein levels at endocytic sites for the two yeasts in this study (green) vs in previous studies (gray). (B) The mean fluorescence intensity of 120-sfGFP- tagged nanocages (n = 367) is linearly proportional to exposure time. Images obtained for indicated exposure times are presented at the top of the graph. (C) Ratiometric comparison between the fluorescence intensity of 120-sfGFP-tagged nanocages (n = 305) and maximum intensity of scSla1-sfGFP at endocytic sites (n = 58). Left panel, image of 120-sfGFP-tagged nanocages. Right panel, single frame from a processed movie of scSLA1-sfGFP cells. The nanocage image and the scSLA1-sfGFP movie has been imaged using the same imaging system and the images were processed and analyzed using the same particle tracking parameters. Red circles indicate the sites automatically detected by the tracking program. The intensity (middle) and molecular numbers (bottom) were determined and plotted. (D) Maximum molecular number of scMyo5 (n = 210), scSla1 (n = 152) and scLas17 (n = 112) at endocytic sites as well as the molecular number of scCse4 (n = 17) on the kinetochore clusters. The molecular numbers were calculated by the ratiometric fluorescence intensity comparison of the indicated sfGFP-tagged proteins and 120-sfGFP-tagged nanocages. (E-G) Maximum molecular numbers for indicated proteins at endocytic sites in budding (blue) and fission (brown) yeast. The molecular numbers were calculated by the ratiometric fluorescence intensity comparisons using scSla1, scLas17, or scMyo5 as standards (Figure 2—figure supplement 2, Table 2). For each indicated protein, at least 50 endocytic sites were examined. The scale bars on the images are 2 µm.


