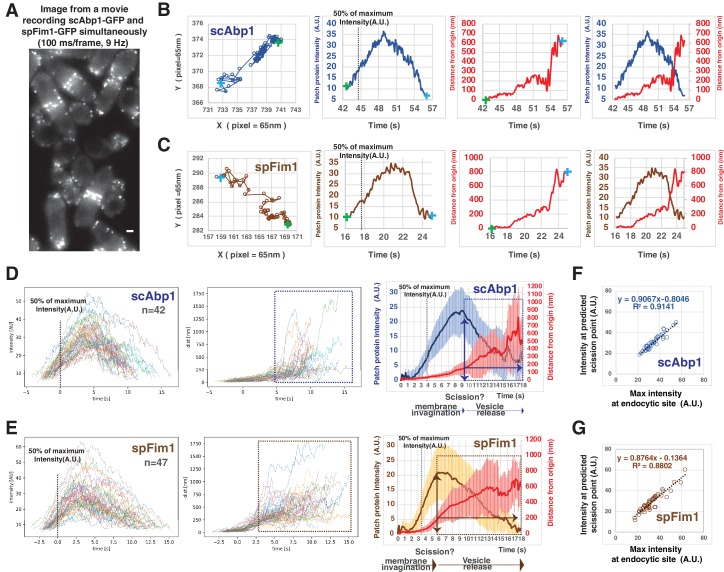
Figure 3. Quantitative comparison of endocytic actin dynamics in budding and fission yeast.
(A) Single frame from a movie of simultaneously imaged scABP1-GFP in budding yeast and spfim1-mEGFP in fission yeast. (B and C) Single endocytic events represented by scAbp1 in budding yeast (B) and by spFim1 in fission yeast (C) were tracked and then analyzed using our custom software. Graphs from left to right: (Left) Protein patch centroid position over time. Consecutive positions are connected by lines. '+' in green or in blue indicates the first or the last position, respectively. (Left Center) Fluorescence intensity over time. Dotted line indicates the time point when fluorescence intensity reaches 50% of its maximum intensity. (Right Center) Displacement over time. Displacement from the origin is the distance from the position of each time point to the starting position ('+' in green). (Right) Fluorescence intensity and displacement over time. (D and F) Numerous endocytic events tracked by imaging fluorescent scAbp1 (D) or spFim1 (E) were analyzed and aligned. Graphs from left to right: numerous endocytic events aligned to the point of 50% of maximum intensity (indicated by dotted line); displacement data for same cells as in right panel aligned according to 50% maximum intensity point (boxed areas represent inferred movement after scission); combined average results from graphs on the left (note that time and intensity are rescaled on the averaged data graphs). Dotted line indicates the time point when fluorescence intensity reaches to 50%. Vertical line with arrow indicates the inferred moment of scission predicted by the dramatic increase in standard deviation (Figure 3—figure supplement 1). Standard deviation is represented by the shadow around the average line. (F and G) Inferred endocytic scission is tightly correlated with the time when endocytic actin assembly reaches its maximum for budding (F) and fission yeast (G). The scale bars on cell pictures are 2 µm.
Figure 3—figure supplement 1. Predicting the timing of endocytic vesicle scission by the changes of the standard deviation of actin patch displacement.


