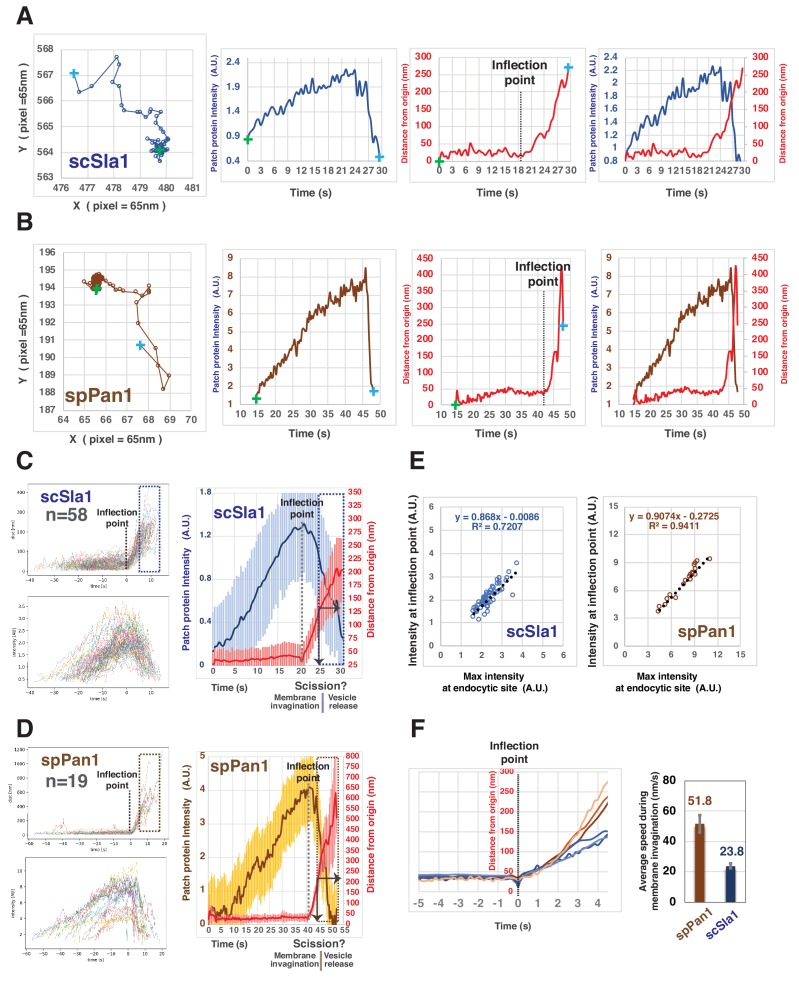
Figure 4. Quantitative comparison of endocytic coat dynamics for budding and fission yeast.
(A and B) Single endocytic event detected by tracking fluorescent scSla1 in budding yeast (A) or spPan1 in fission yeast (B). Graphs from left to right: protein patch centroid position over time, '+' in green or in blue indicate the first and last positions, respectively; fluorescence intensity over time; displacement over time ('+' in green and blue indicate starting and end points, respectively while the dotted line indicates the inflection point at which time the coat protein begins to move; fluorescence intensity and displacement over time. (C and D) Numerous endocytic events detected by tracking fluorescent scSla1 (C) or by spPan1 (D) were analyzed and aligned. Graphs from left to right: numerous endocytic events aligned at inflection points indicated by the dotted line, the boxed area represents movement after inferred scission event; fluorescence intensity aligned by the movement inflection point; combined average results from the two graphs on the left (note that time and intensity are rescaled in the average graph and that the dotted line indicates inflection point), vertical line with arrow indicates the moment of scission predicted by the dramatic standard deviation increase. Standard deviation is represented by the shadow around the average line. (E) Initiation of endocytic membrane invagination is tightly correlated with the time when the endocytic coat reaches its maximum amount in budding and fission yeast. (F) Speed of coat protein movement during the inferred invagination process prior to scission. Each of the brownish or bluish lines represents the average displacement of spPan1 or scSla1, respectively, over time from one experiment. Three independent experiments were performed for the indicated proteins. Bar graphs show rates for coat proteins.

