. 2019 Dec 12;8:e50749. doi: 10.7554/eLife.50749

Figure 5. Spatial-temporal relationship of coat proteins, scission proteins and the actin network at fission yeast endocytic sites.

(A) Single frame from a movie of spPan1-mEGFP and spFim1-mCherry expressed in fission yeast cells. (B) Alignment of average intensity (solid lines) and displacement (dotted lines) of spPan1-mEGFP (coat) and spFim1-mCherry (actin cytoskeleton) patches (n = 15) (Figure 5—figure supplement 1 for details). Vertical dotted line one indicates the time when actin assembly is first detected. Vertical dotted line two marks the inferred initiation of membrane invagination. Vertical dotted line three indicates the inferred scission event. (C) Single frame from a movie of spHob1-GFP spFim1-mCherry expressed in fission yeast cells. (D) Alignment of average intensity (solid lines) and displacement (dotted lines) of spHob1-GFP (scission protein) and spFim1-mCherry (actin cytoskeleton) patches (n = 23) (Figure 5—figure supplement 2 for details). Vertical dotted line one indicates the time when spHob1-GFP is first detected. Vertical dotted line two marks inferred initiation of membrane invagination. Vertical dotted line three indicates inferred scission event. Scale bars on cell pictures are 2 µm.

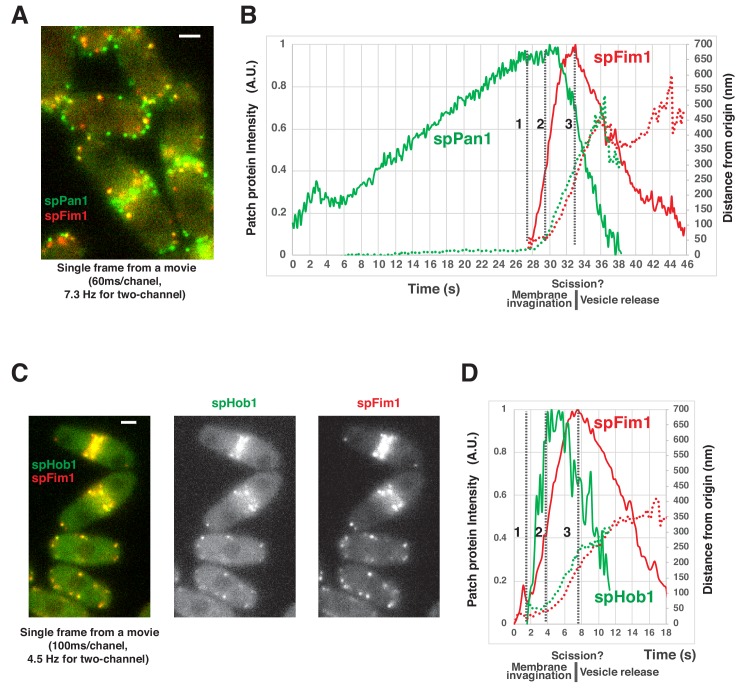
Figure 5.

Figure 5—figure supplement 1. Alignment and quantification of average trajectories for spFim1-mCherry and spPan1-mEGFP in fission yeast.

Figure 5—figure supplement 1.

(A) Alignment of intensity and displacement of spPan1-mEGFP and spFim1-mCherry for a single endocytic event. Two examples are presented. (B) Alignment of average intensity and displacement plots for spFim1-mCherry (upper graph) and spPan1-mEGFP (lower graph) patches. Dotted vertical line aligns two graphs. Dotted boxes indicate inferred movement after scission. Time and intensity are rescaled in the average graph shown in Figure 5B.
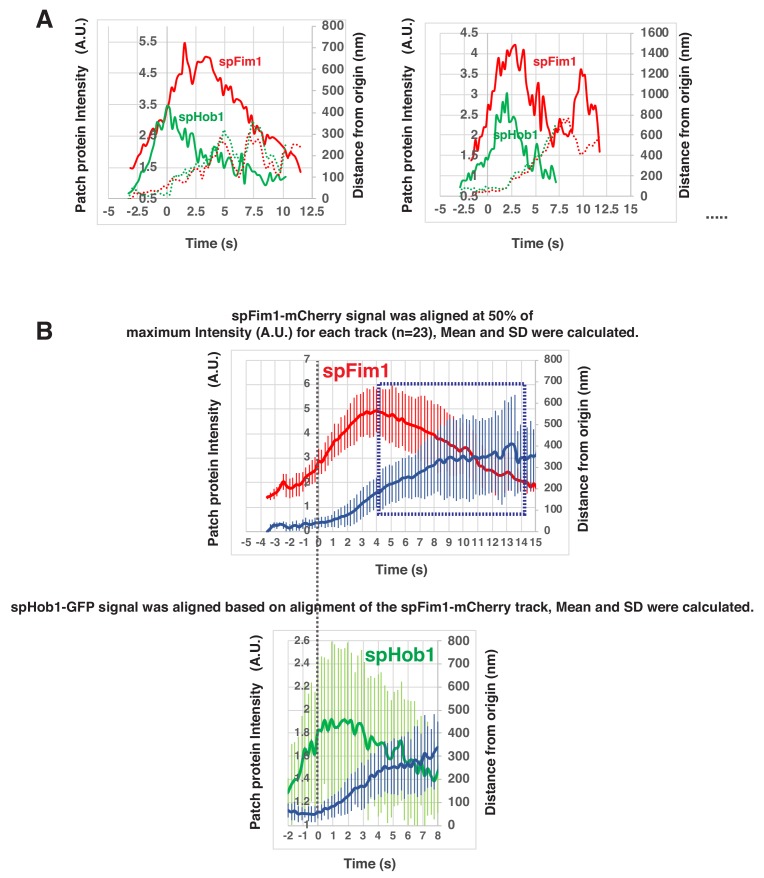
Figure 5—figure supplement 2. Alignment and quantification of average trajectories for spFim1-mCherry and spHob1-GFP in fission yeast.

Figure 5—figure supplement 2.

(A) Alignment of intensity and displacement of spHob1-GFP and spFim1-mCherry for a single endocytic event. Two examples are presented. (B) Alignment of average intensity and displacement plots for spFim1-mCherry (upper graph) and spHob1-GFP (lower graph) patches. Dotted vertical line aligns two graphs. Dotted boxes indicate inferred movement after scission. Time and intensity are rescaled in the average graph shown in Figure 5D.