. 2019 Dec 12;8:e50749. doi: 10.7554/eLife.50749

Figure 6. 3D-STORM imaging of coat protein and the actin network at fission yeast endocytic sites.

(A and B) The length of nanoscale structures of spFim1 (n = 92) or spPan1 (n = 46) at endocytic sites revealed by STORM analysis was measured and plotted. Representative STORM images of different length and quantitative analysis of spFim1 (A) and spPan1 (B). The histogram shows the frequency distribution of observed endocytic structure lengths. C, 3D-STORM image analysis reveals ring-like Pan1 organization in the XZ dimensions. D, Representative images of presumed endocytic vesicles in the cytoplasm. The length of longest axis of each presumed vesicle was measured and plotted. Fim1-labeled structures were pseudo-colored red hot (A and D) and Pan1-labeled structures were pseudo-colored green fire blue (B, C, D). The scale bars on STORM images are 100 nm.

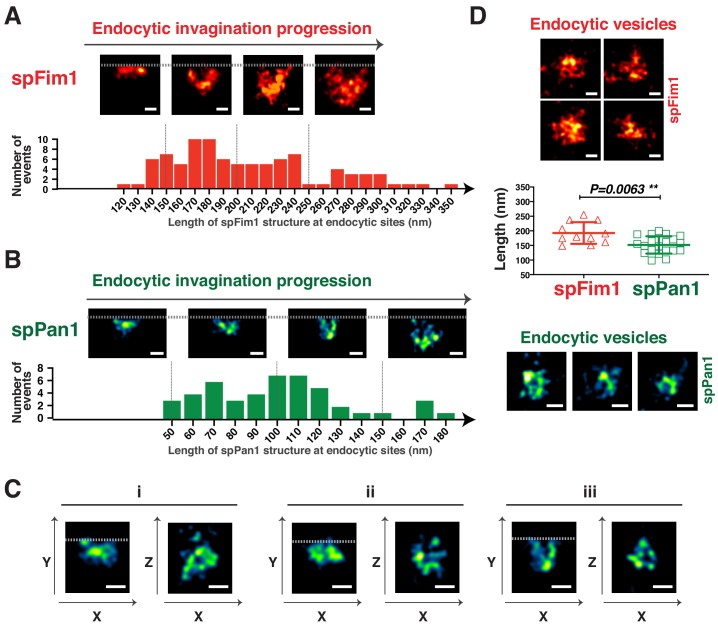
Figure 6.

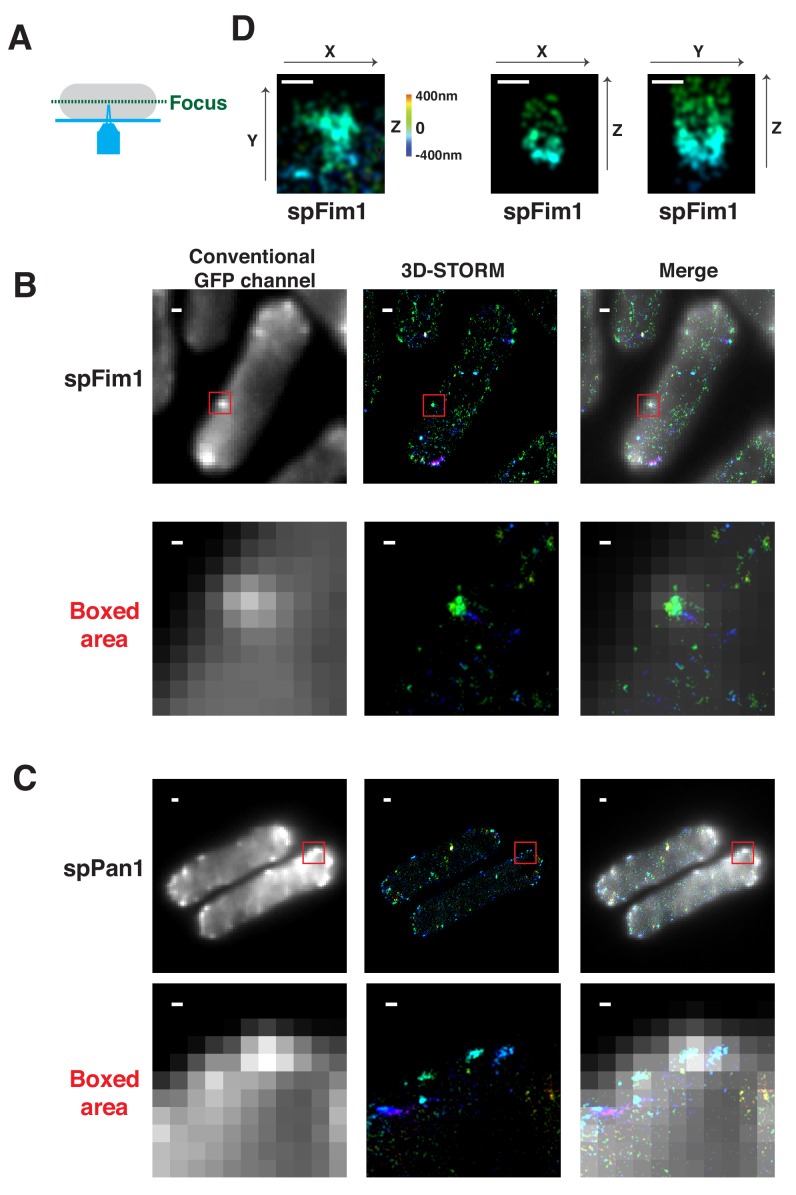
Figure 6—figure supplement 1. 3D-STORM imaging of spFim1 and spPan1.

Figure 6—figure supplement 1.

(A) Chemically fixed fission yeast cells expressing mEGFP-tagged proteins were labeled with AF647-conjugated anti-GFP nanobodies and imaged at the equatorial plane. (B) Conventional and 3D-STORM image for a fixed fission yeast cell expressing spFim1-mEGFP and labeled using AF647-conjugated anti-GFP nanobodies. (C) Conventional and 3D-STORM image of fixed fission yeast cell expressing spPan1-mEGFP and labeled using AF647-conjugated anti-GFP nanobodies. (D) 3D-STORM image of spFim1-mEGFP at an individual endocytic site. Images represent XY, XZ, or YZ dimensions. Note, the Z-axis information is represented by rainbow color. The scale bars on the images of whole cells are 1 µm. The other scale bars in the boxed areas and D are 100 nm.