. 2019 Dec 12;8:e50749. doi: 10.7554/eLife.50749

Figure 7. Spatio-temporal relationship between two major NPFs and endocytic actin assembly in fission yeast.

(A) Dynamics of spWsp1. Numerous endocytic events represented by mEGFP-spWsp1 were analyzed and aligned. Graphs from left to right: (right) Protein position vs time for endocytic events (n = 31) aligned at inflection points indicated by the dotted line. The boxed area represents movement after presumed scission event. (middle) Fluorescence intensity aligned on basis of alignment in right graph. (left) Averaged results from data in two graphs on the left. Note that time and intensity are rescaled in this graph. The dotted line indicates inflection point. Vertical solid line with arrow indicates the moment of scission predicted by the dramatic standard deviation increase. (B) Single frame from a movie of fission yeast expressing mEGFP-spWsp1 spFim1-mCherry (left panel). Time series showing composition of a single endocytic site (right panels). (C) Alignment of average intensity and displacement for mEGFP-spWsp1 and spFim1-mCherry patches (n = 8) (Figure 7—figure supplement 2 for details). Dotted line one indicates actin assembly initiation. Dotted line two indicates initiation of membrane invagination. Dotted line three indicates inferred scission. (D) Single frame from a movie of fission yeast expressing mEGFP-Myo1 and spFim1-mCherry (left panel). Time series showing composition of a single endocytic site (right panels). (E) Alignment of average intensity and displacement for mEGFP-spMyo1 and spFim1-mCherry patches (n = 9) (Figure 7—figure supplement 3 for details). Dotted line one indicates actin assembly initiation. Dotted line two indicates initiation of membrane invagination. Dotted line three indicates inferred scission. Scale bars are 2 µm.

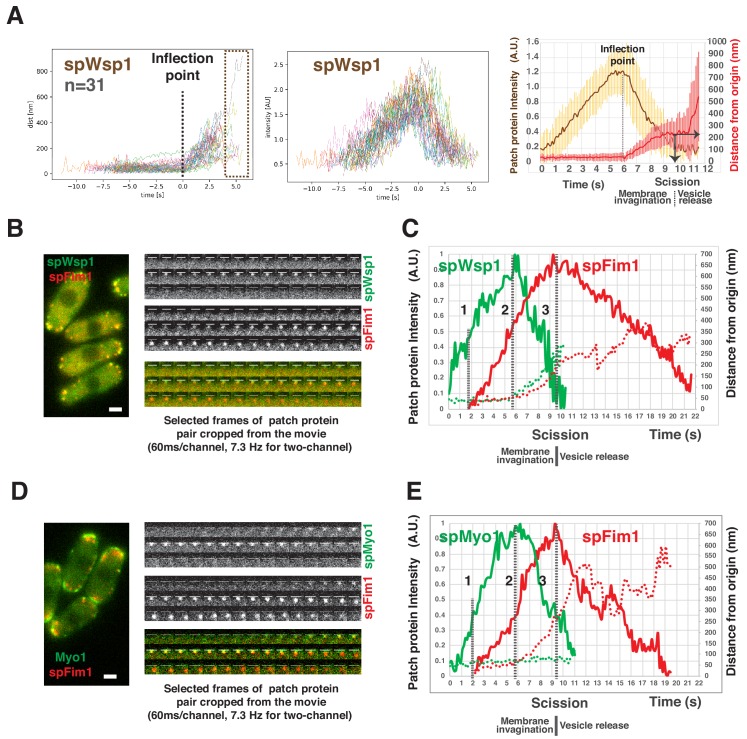
Figure 7.

Figure 7—figure supplement 1. Dynamics of GFP-scLas17 and scLas17-GFP in budding yeast.

Figure 7—figure supplement 1.

(A) Dynamics of scLas17-GFP and GFP-scLas17. Single frames (left) from movies, radial kymograph representations (Sun et al., 2017) (middle), and time series showing progression of a single endocytic event (right) for scLas17-GFP (upper panel) and GFP-scLas17 (lower panel). The arrowheads indicate that a small amount of GFP-scLas17 signal splits from the majority of the signal at the end of its lifetime. (B) Lifetimes of scLas17-GFP and GFP-scLas17 at endocytic sites. (C) Single frames (left) from movies and circumferential kymograph representations (Sun et al., 2017) of GFP-LAS17 ABP1-RFP cells (upper panel) and GFP-LAS17 MYO5-RFP cells (lower panel). Scale bars are 2 µm. Scale bars on kymograph are 10 s.
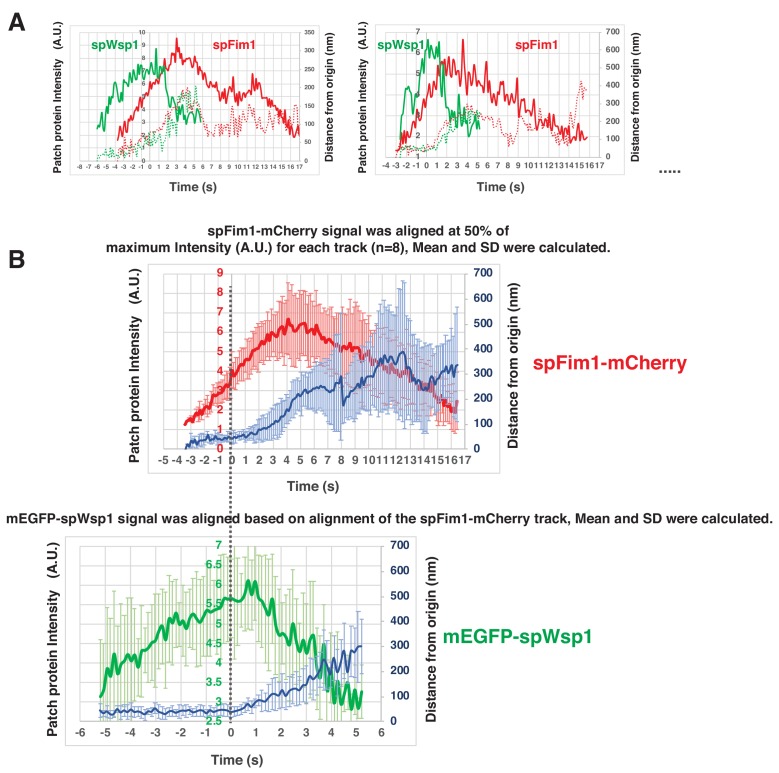
Figure 7—figure supplement 2. Alignment and quantification for average trajectories for spFim1-mCherry and mEGFP-spWsp1 in fission yeast.

Figure 7—figure supplement 2.

(A) Alignment of intensity and displacement for mEGFP-spWsp1 and spFim1-mCherry for a single endocytic event. Two examples are presented. (B) Alignment of average intensity and displacement of mEGFP-spWsp1 and spFim1-mCherry patches. Time and intensity are rescaled in the average graph shown in Figure 7C.
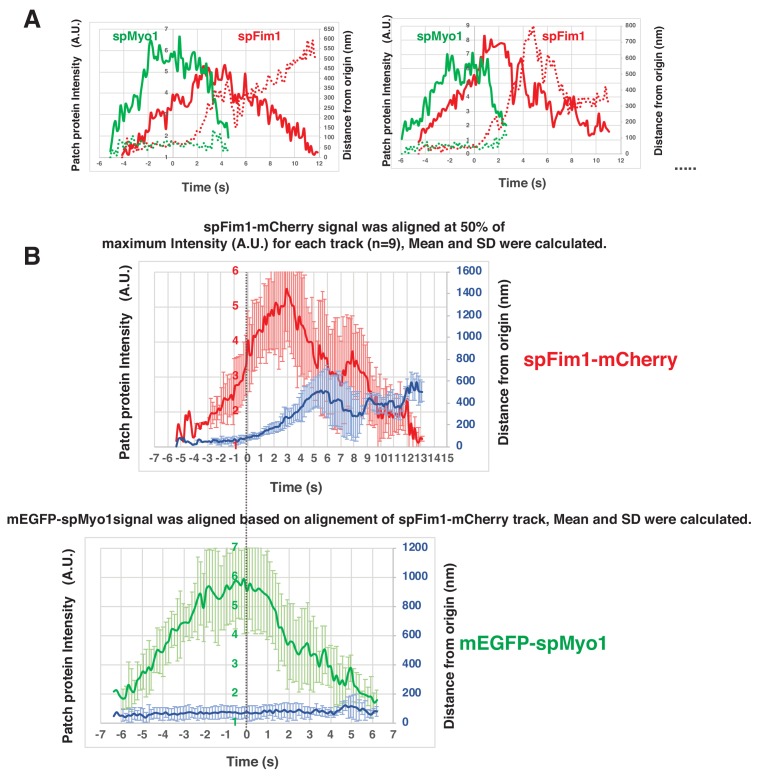
Figure 7—figure supplement 3. Alignment and quantification for average trajectories for spFim1-mCherry and mEGFP-spMyo1- in fission yeast.

Figure 7—figure supplement 3.

(A) Alignment of intensity and displacement for mEGFP-spMyo1 and spFim1-mCherry for a single endocytic event. Two examples are presented. (B) Alignment of average intensity and displacement for mEGFP-spMyo1 and spFim1-mCherry patches. Time and intensity are rescaled in the average graph shown in Figure 7E.