. 2019 Dec 12;8:e51114. doi: 10.7554/eLife.51114

Figure 5. Increased cardiac expression of Stj contributes to the conduction defects observed in DM1 fly models.

(A) Stj protein is detected at a low level in cardiomyocytes (CM) but at a higher level in the ventral longitudinal muscles (VLMs) that underlie adult heart tube. Stj in VLMs and in heart tube-attaching alary muscles (AMs) marks the network of T-tubules. PC denotes pericardial cells. Scale bars, 50 μm. (B) Scheme of the adult Drosophila heart with representation of Stj expression. (C) Both Hand-Gal4 (whole heart) and Tin-Gal4 (cardiomyocytes only) driven overexpression of Stj lead to asynchronous heartbeats similar to those observed in Hand>MblRNAi and Hand>Bru-3 contexts. (D) Barplot representing percentage of Hand>MblRNAi and Hand>Bru-3 flies displaying asynchronous heartbeats after reducing cardiac Stj expression via RNAi (in stj rescue conditions). Notice that lowering Stj expression efficiently reduces the risk of asynchronous heartbeats in Hand>Bru-3 context. Number of fly hearts tested (n) is indicated and statistical significance (Fisher’s exact test) denoted by ns (p>0.05) and * (p<0.05). (E) IGV tracks showing RNAseq peaks over the stj locus in healthy control and pathological contexts. Red boxes highlight stj-RC – specific exon 15 tracks enriched in Hand>MblRNAi and Hand>Bru-3 contexts and 3’UTR-specific tracks.

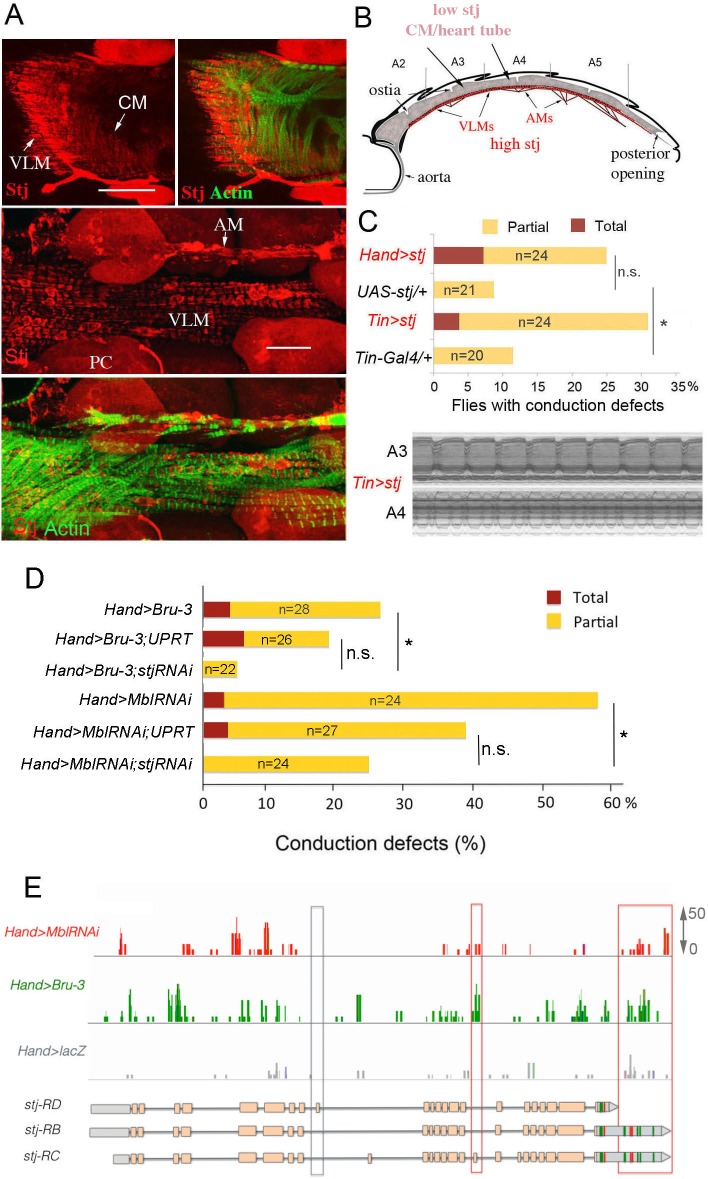
Figure 5—source data 1. Corrected total cell fluorescence (CTCF) of Stj signal in circular fibers of cardiomyocytes.

Figure 5.

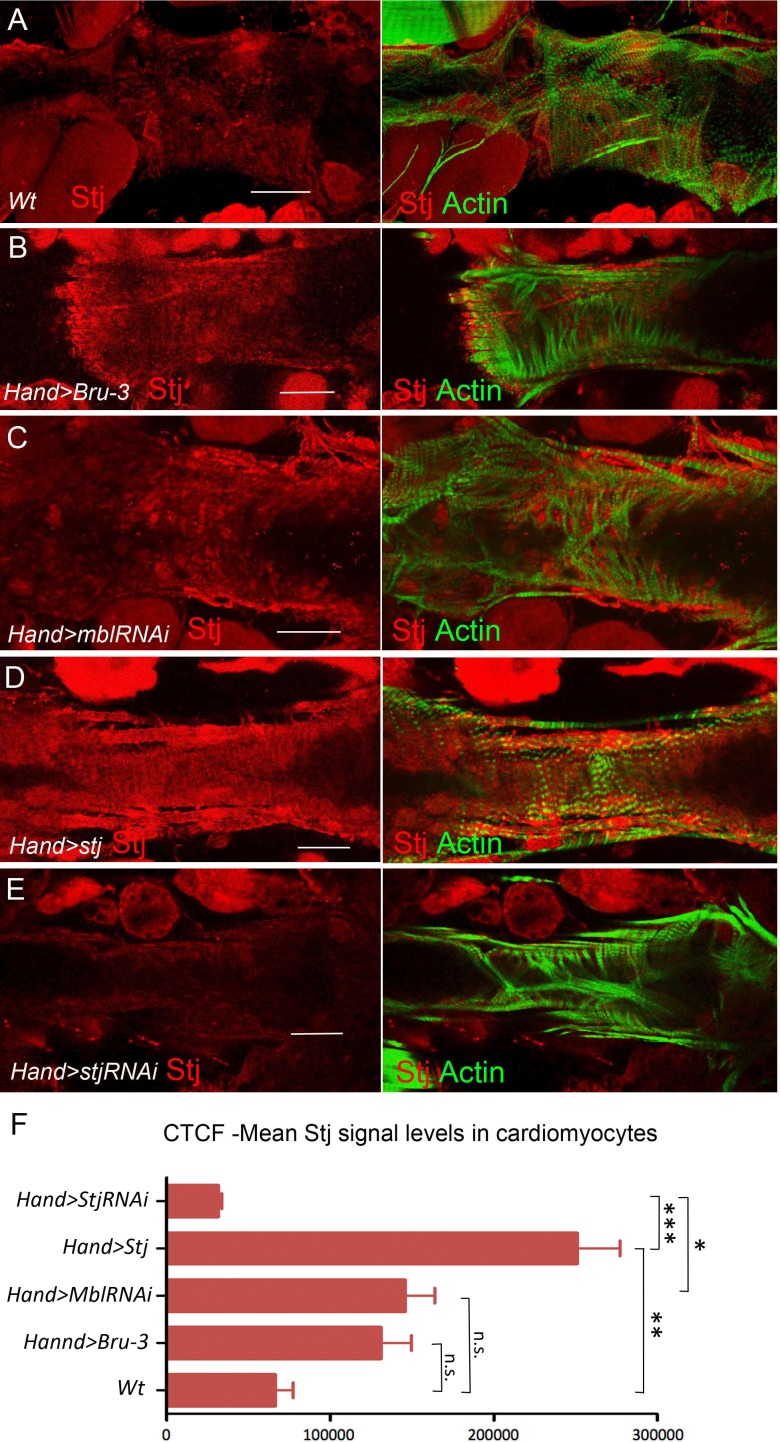
Figure 5—figure supplement 1. Stj protein levels in different genetic contexts visualized by immunostaining.

Figure 5—figure supplement 1.

Stj protein expression (red) in circular fibers of cardiomyocytes in wild-type (wt) (A) and in different genetic contexts (B-E) tested. Circular fibers are visualized with phalloidin staining (green). Notice that Stj protein levels appear higher in Hand>Bru-3 and in Hand>MblRNAi compared to wt. High signal level in Hand>stj and loss of signal in Hand>stjRNAi demonstrate also the specificity of stj antibody. Scale bars, 50 μm. (F) Corrected total cell fluorescence (CTCF) of Stj signal in circular fibers of cardiomyocytes (Figure 5—source data 1) in different genetic contexts measured using Image J according to Burgess et al. (2010). Statistical significance (Kruskal-Wallis test) denoted by ns (p>0.05) * (p<0.05), ** (0.01) and *** (p<0.001).
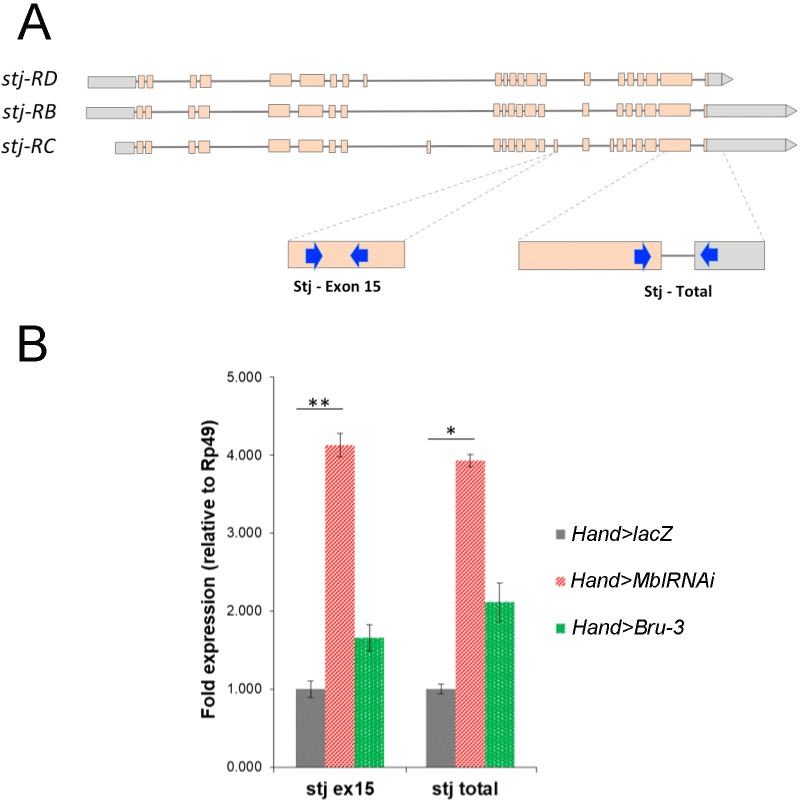
Figure 5—figure supplement 2. stj-RC transcript isoform carrying long 3’UTR and alternatively spliced exon 15 is up regulated in Hand>MblRNAi and in Hand>Bru-3 hearts.

Figure 5—figure supplement 2.

(A) RT-qPCR probes for stj-RC specific exon 15 and for total stj transcripts are indicated on the scheme. (B) RT-qPCR analysis of stj-RC and total stj transcript levels in control (Hand>lacZ) fly hearts and in two DM1 contexts (Hand>MblRNAi and Hand>Bru-3). One-way ANOVA, Kruskall-wallis Dunn’s multiple comparison post-test was applied for assessing statistical significance (* - p<0.05; ** - p<0.001).