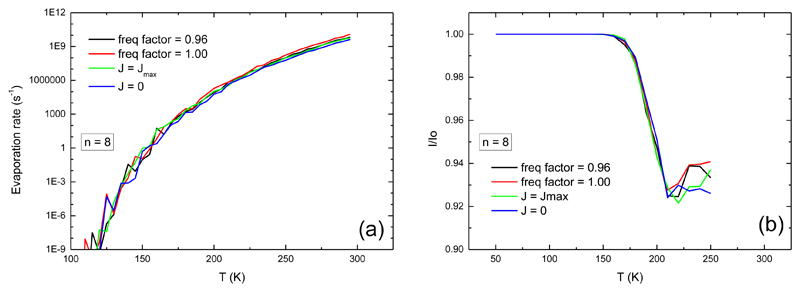
Fig. 10.
Influence of J and of the frequency factor on (a) the canonical evaporation rate and (b) the ratio I/I0 for n=8 pyrene clusters. Black curve: frequency factor is 0.96, thermal distribution of J; red curve: frequency factor is 1.0 and thermal distribution of J; green curve: frequency factor is 0.96 and J is taken as its most probable value; blue curve: frequency factor is 0.96 and J is 0.

