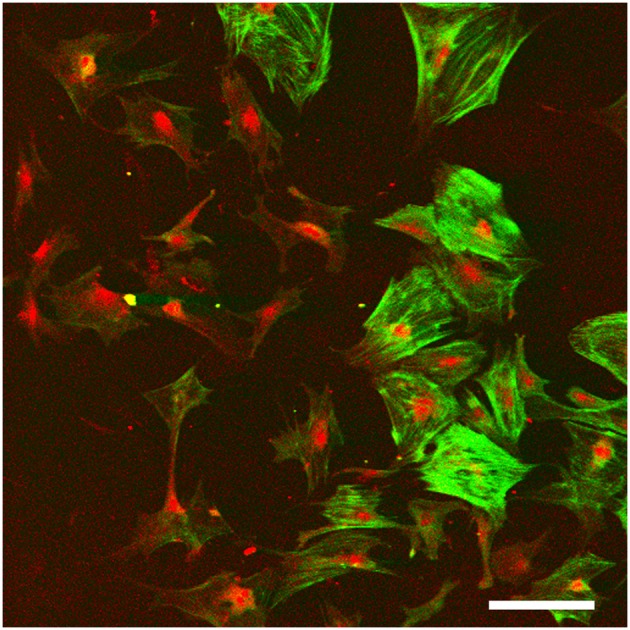
Figure 5.

Monolayer fibrocyte culture after immunofluorescence labeling for caldesmon (green) and Na, K, ATPase (red). The cells exhibit a mixed phenotype with some cells labeled strongly for both, and others labeled primarily for the Na, K, ATPase. Scale bar = 100 μm. Image taken from conference presentation, cited in published proceedings by Furness (2014).
