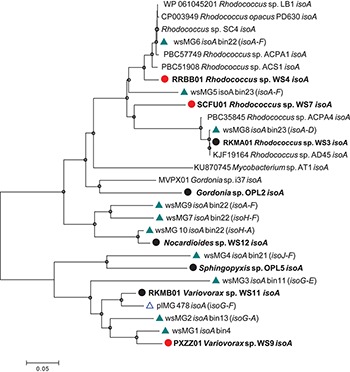
FIGURE 2.

Phylogenetic analysis of isoA sequences obtained during this study. Trees were constructed with the neighbor-joining method. The analysis was carried out with 28 complete isoA sequences from extant isoprene-degraders, new isoprene-degrading isolates obtained in this study (filled circles, red for isolates from the willow soil DNA-SIP) and 11 complete isoA metagenome sequences [green triangles, wsMG (from willow soil SIP-metagenome); blue open triangles, plMG (from poplar leaf metagenome in blue from Crombie et al., 2018)]. Following removal of gaps and missing data, there were 1,428 bp in the alignment. Bin numbers are included following the isoA-containing contig identifications. Names of neighboring isoprene metabolic genes in the same contig are included in parentheses. Bootstrap values [1000 replications (Satola et al., 2013)] over 75% are shown as circles in the nodes. The scale bar indicates nucleotide substitutions per site.
