
Figure 10.
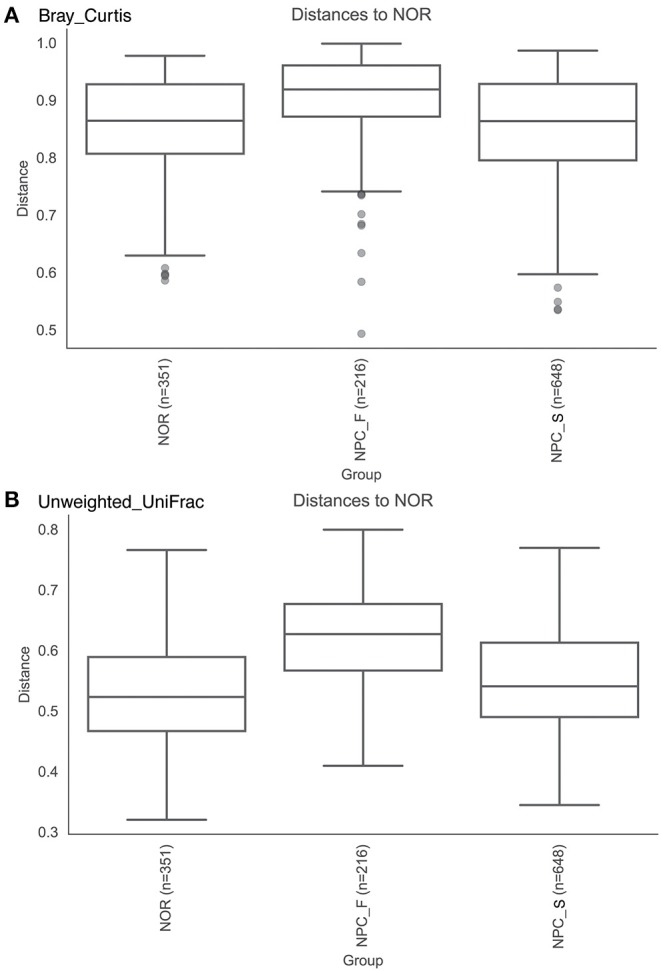
The comparision of Beta diversity among the healthy controls (NOR), familial NPC patients (NPC_F), and sporadic NPC patients (NPC_S) groups based on different indices. (A) Bray-Curtis distance index, Anosim. (B) Unweighted UniFrac distance index, Anosim.