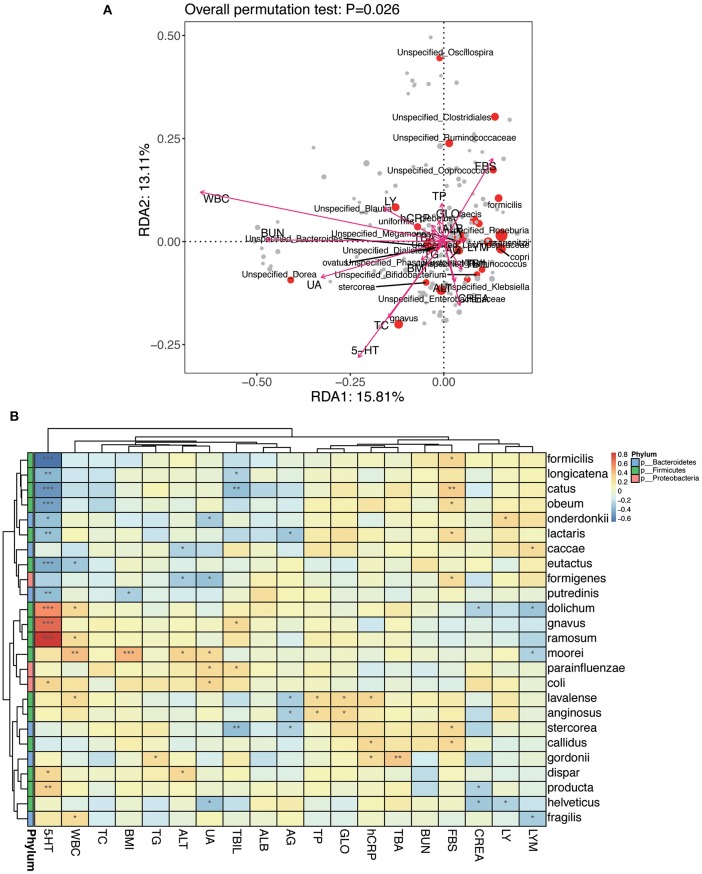
Figure 12.
The relationship between intestinal flora and clinical variables at the species level. (A) RDA ranking map; RDA1:15.81% and RDA2:13.11% represent the magnitude of the percentage of variance interpreted in the direction of the two axes, respectively. (B) Heat map for Spearman correlation analysis between intestinal flora and clinical variables at the species level. *P < 0.05, **P < 0.01, ***P < 0.001.

