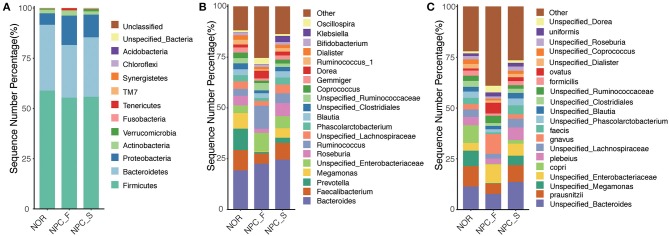
Figure 5.
Comparison of relative taxa abundance among the healthy controls (NOR), familial NPC patients (NPC_F), and sporadic NPC patients (NPC_S) groups at phylum, genus and species levels. (A) The bar chart of relative taxa abundance among the three groups at phylum levels. (B) The bar chart of relative taxa abundance among the three groups at genus levels. (C) The bar chart of relative taxa abundance among the three groups at species levels.

