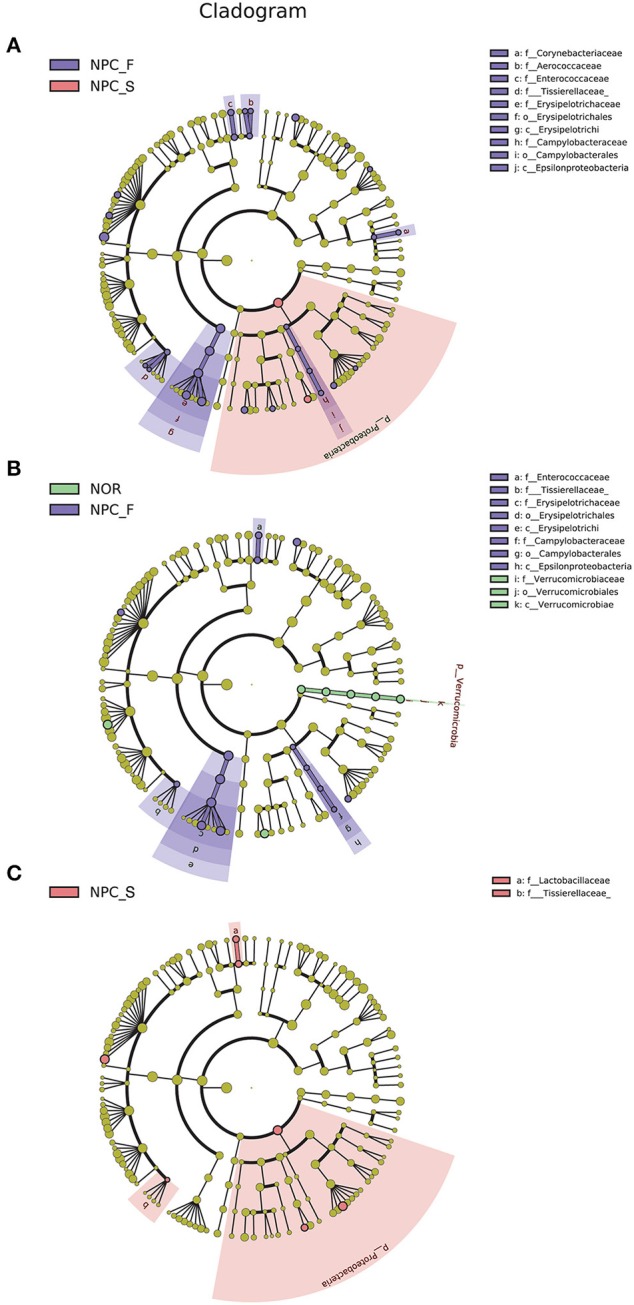
Figure 7.

Enriched flora in the healthy controls (NOR), familial NPC patients (NPC_F), and sporadic NPC patients (NPC_S) groups are represented in a cladogram. The origin of the tree (bacteria) showed in the central point, the larger circles centered on the center represent decreasing species levels from phylum to genus (phylum to genus: p, phylum; c, class; o, order; f, family; g, genus). The relative abundance of the flora is showed by each circle's diameter. (A) LEfSe analysis cladogram of intestinal flora among NOR, NPC_F and NPC_S groups at genus level. (B) LEfSe analysis cladogram of intestinal flora between NOR and NPC_F at genus level. (C) LEfSe analysis cladogram of intestinal flora between NOR and NPC_S at genus level.
