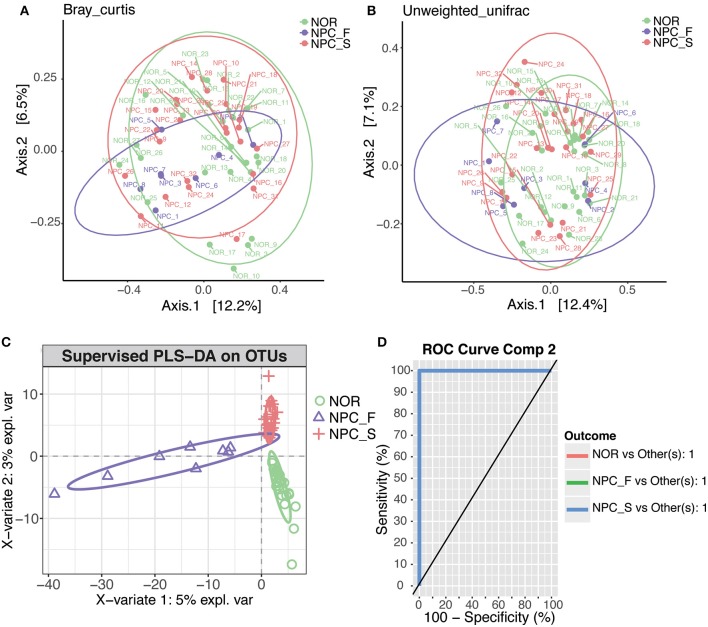
Figure 8.
PCoA and PLS-DA analysis of the microbiome among the healthy controls (NOR), familial NPC patients (NPC_F), and sporadic NPC patients (NPC_S) groups, different points or patterns are on behalf of different samples, different groups are showed in different colors, each large circle represents a group. The degree of discrepancy of the microbial structure of the samples is showed by the distance between the points or patterns. (A) Bray-Curtis PCoA based on the relative abundance of OTU (99% similarity level), NOR: green points, NPC_F: purple points, NPC_S: red points. (B) Unweighted UniFrac PCoA based on the relative abundance of OTU (99% similarity level), NOR: green points, NPC_F: purple points, NPC_S: red points. (C) The PLS-DA analysis on OTUs among the NOR, NPC_F and NPC_S groups, NOR: green circles, NPC_F: purple triangles, NPC_S: red crosses. (D) ROC analysis for the predictive value of the predictive model constructed based on PLS-DA analysis. The AUCs of the NOR, NPC_F and NPC_S groups all are 1.

