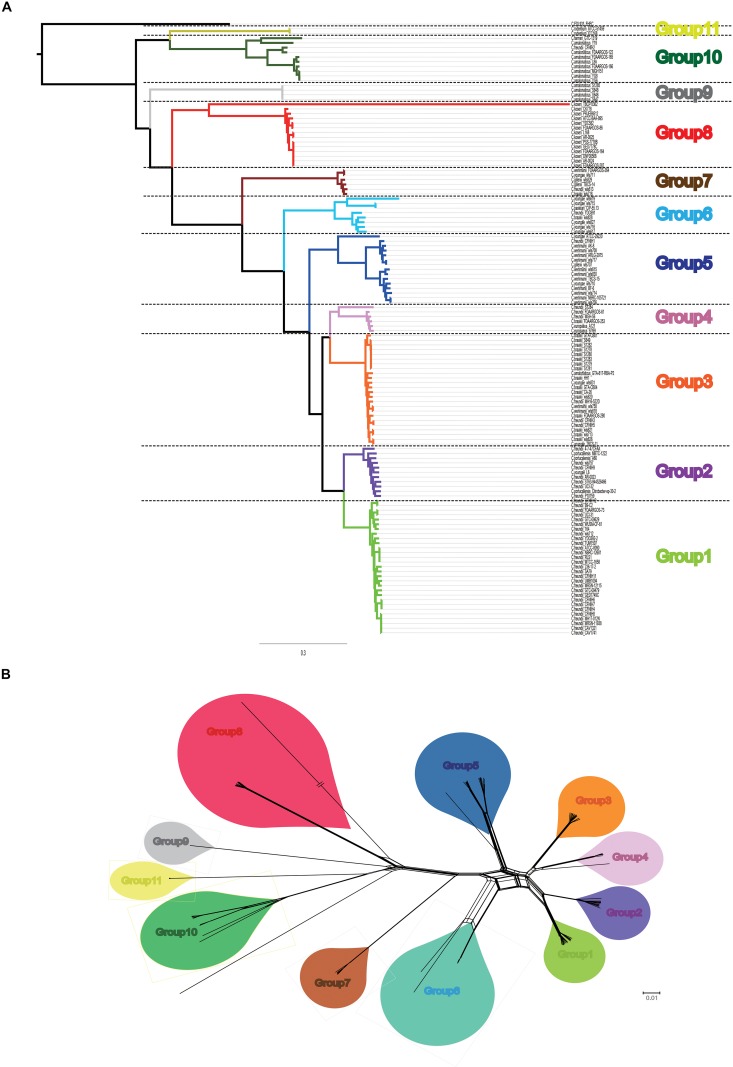
FIGURE 1.
Core genome-based phylogeny. (A) Maximum likelihood tree was constructed using PhyML based on 1450 single-copy core genes shared by 129 Citrobacter strains. Different group are shown in different colors. (B) Neighbor Net (NNet) splits graphs based on uncorrected p-distances inferred from 1450 single-copy core genes shared by 129 Citrobacter strains. NNet splits graphs were constructed and visualized with SplitsTree4. Different group are shown in different colors, which was corresponding to our phylogenetic tree.

