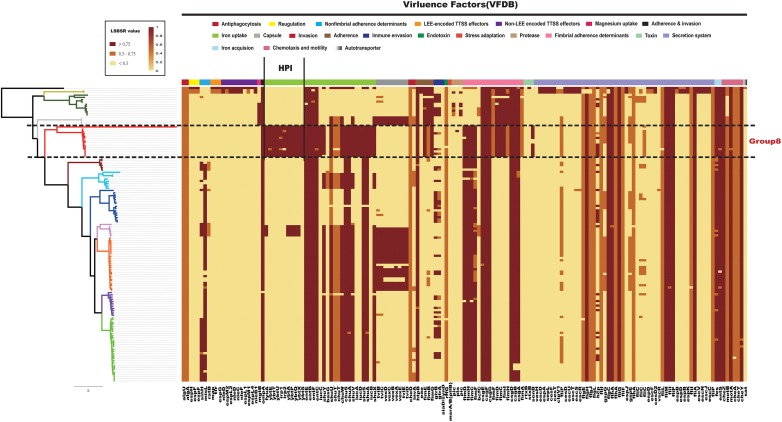
FIGURE 4.
Distribution heatmap of virulence factors across Citrobacter strains. Color coding for virulence factors corresponds to the score ratio recorded for each genome when screened with the reference Virulence Factors Database. For a full outline of sources, see Supplementary Table S2. In the current presentation, we removed the virulence factors of previously studied macromolecular secretion systems and O-antigen/LPS/Capsule.

