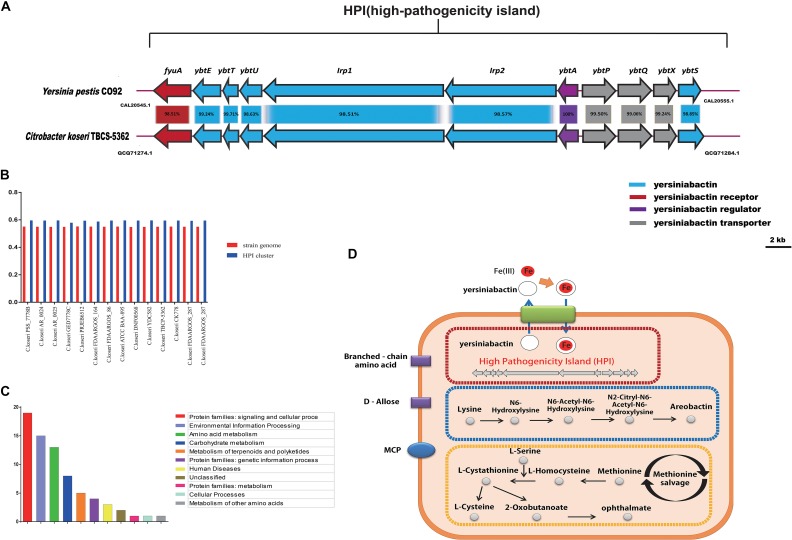
FIGURE 8.
Group 8-specific core genome. (A) Model of HPI in Citrobacter koseri TBCP-5362. The percentage of protein identity for each set of homologous genes is shown. Homologous genes are colored similarly (see box below). (B) GC content of HPI in strains of Group 8. (C) Functional enrichment of Group 8-specific core genome after KEGG annotation. (D) Sketch map of the Group 8-specific core genome after KEGG annotation.

