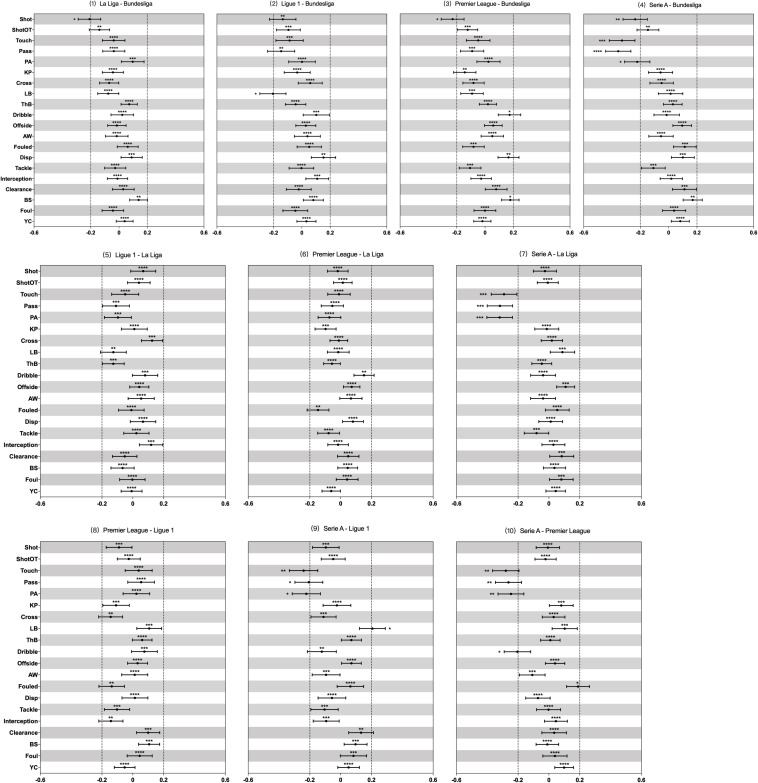
FIGURE 1.
Standardised effects of differences in mean count of each match action or event between five UEFA leagues estimated from the generalised mixed linear modelling. Bars are 90% confidence intervals. Asterisks indicate the likelihood for the magnitude of the true effect as follows: ∗possible; ∗∗likely; ∗∗∗very likely; ****most likely. Asterisks located in the area between –0.2 and 0.2 denote for trivial differences. ShotOT, shot on target; PA, pass accuracy in %; KP, key pass; LB, long ball; ThB, through ball; AW, aerial won; Disp, dispossessed; BS, blocked shot; YC, yellow card.

