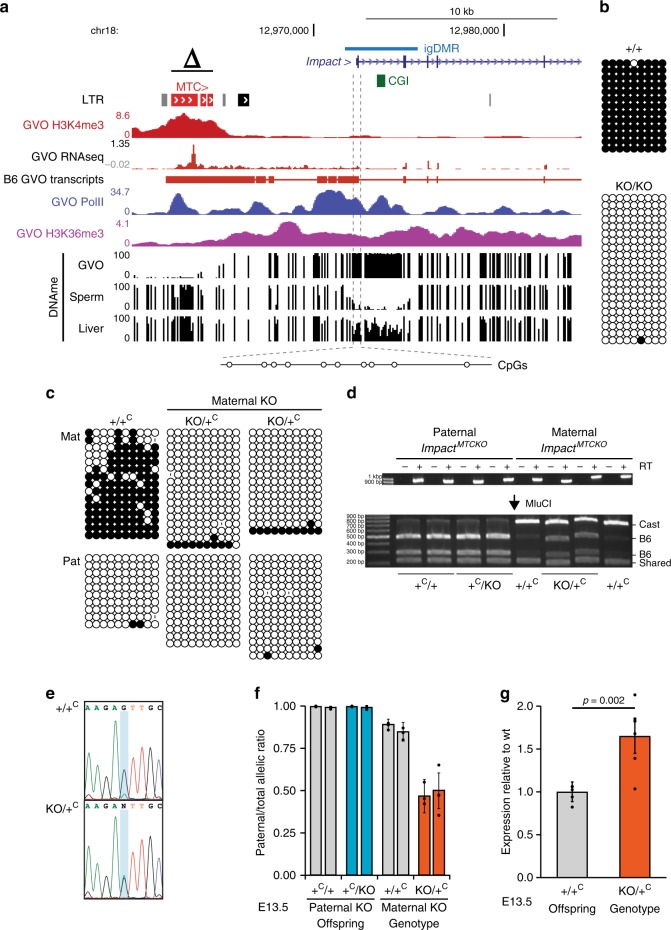
Fig. 6. Loss of imprinting at Impact upon maternal transmission of the MTC KO allele.
a Genome-browser screenshot of the mouse Impact locus, including the upstream MTC LTR (red), CGI (green), and igDMR (blue). GVO RNA-seq as well as RNA pol II, H3K4me3, and H3K36me3 ChIP-seq tracks are shown, along with DNAme data for GVO, sperm, and adult liver. The region within the igDMR analyzed by sodium bisulfite sequencing (SBS), which includes 10 CpG sites, is shown at the bottom. Δ: extent of the upstream MTCKO deletion allele. b DNAme of the Impact igDMR in GVO from wild-type and ImpactMTCKO/MTCKO females determined by SBS. c DNAme of the Impact igDMR in E13.5 (Impact+/MTCKO × CAST)F1 embryos determined by SBS. Data for control (+/+C) and heterozygous (KO/+C) littermates with a maternally inherited MTCKO are shown. +C: wild-type CAST allele; KO: ImpactMTCKO. A polymorphic insertion and a SNP in the amplified region allow for discrimination of maternal (Mat) and paternal (Pat) strands. d, e Allele-specific expression analysis of F1 E13.5 embryonic head RNA by d RT-PCR followed by MluCI RFLP analysis, and e Sanger sequencing of a A ⟷ G transition in the 3′UTR of the Impact mRNA (maternal B6: A allele; and paternal CAST: G allele). RT: reverse transcriptase. Source data are provided as a Source Data file. f Quantification of relative levels of expression from the paternal Impact allele based on the analysis of embryos as in e. Graph shows mean ± S.D of three SNPs. Source data are provided as a Source Data file. g Impact mRNA levels analyzed by RT-qPCR on E13.5 embryonic RNA (n = 6 biologically independent samples). Expression levels are relative to those for the wild-type allele. Graph shows mean ± S.E.M. Source data are provided as a Source Data file.

