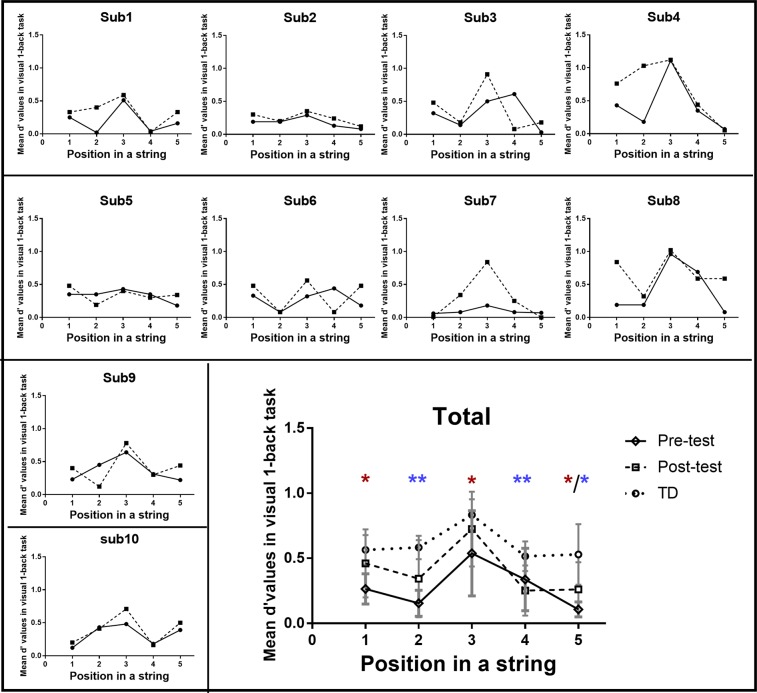
Figure 3.
Individual and group data of the position-based d-prime values in visual 1-back task for the trained dyslexics with visual attention span deficit. Small line charts present the individual data of each participant; the large line chart presents the group average of the position-base d-prime values in the visual task. Error bars in the large line chart indicate standard deviations. Solid lines represent performance before training; dashed lines represent performance after the visual training. Additionally, dot line in the large chart represents the position-based performance in typically developing children. *p < 0.05; **p < 0.01. Red asterisks indicate the significant difference between pre- and post- tests; blue asterisks indicate the significant difference between trained dyslexics with VAS deficit and normal readers in the post-test condition.

