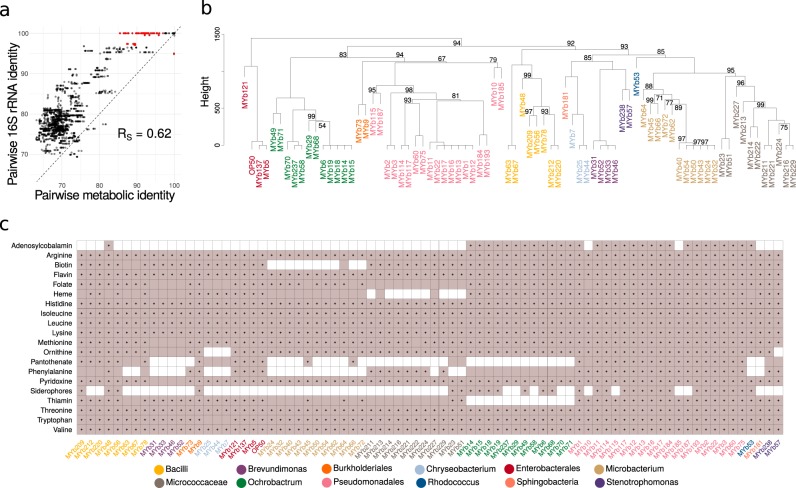
Fig. 2.
Metabolic network clustering and distribution of important pathways. a Correlation between pairwise similarities in 16S rRNA sequences and metabolic networks is shown. Red indicates pairs with a 16S rRNA identity above 97% and metabolic identity below 97% and vice versa. b Hierarchical clustering of metabolic networks based on pathway prediction. P-values were calculated via multi-scale bootstrap resampling. In case of full support (i.e., P = 100), P-values are not shown (For a complete list of different unbiased P-values and bootstrap values see Supplementary Fig. S11). c Prediction of bacterial capacity to produce metabolites favoring C. elegans growth. Filled squares in light purple indicate that the metabolic networks predict the presence of the biosynthetic pathway required to produce essential amino acids and co-factors. Black dots within the filled squares indicate that pathway presence is supported by more conservative parameters (BLAST bitscore ≥ 150). Different bacterial genera in b, c are indicated by different colors of the strain names (Table 1)

