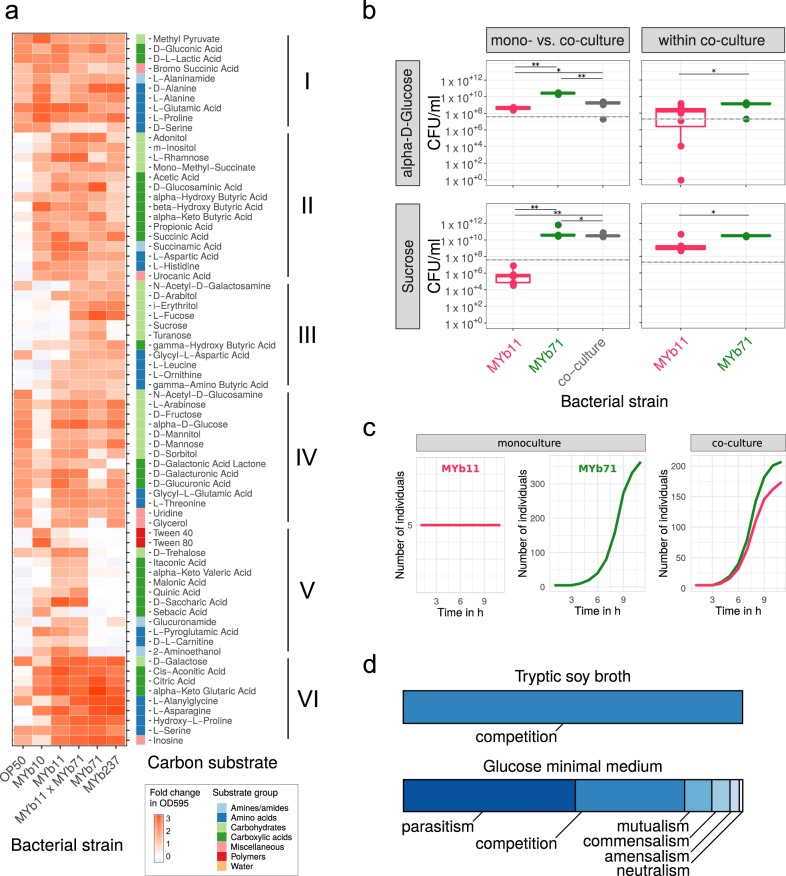
Fig. 3.
Realized carbon metabolism and growth. a Profiles of carbon substrate use of Acinetobacter sp. (MYb10), Pseudomonas lurida (MYb11), Ochrobactrum sp. (MYb71), Ochrobactrum sp. (MYb237), and E. coli OP50 in BIOLOG GN2 plates over 46 h. The fold-change in indicator dye absorption from 0 to 46 h indicates that the particular compound is metabolized. k-means clustering (k = 7) of substrates by fold-change highlights metabolic differences between strains. See Supplementary Fig. S5 for cluster VII with substrates used poorly across most strains. b Colony-forming units per ml (CFU/ml) of MYb11 and MYb71 in mono- and co-culture at 48 h in alpha-d-glucose and sucrose-containing minimal media. The horizontal and dashed lines indicate mean and SD of CFU/ml at inoculation. Statistical differences were determined using Mann–Whitney U-tests and corrected for multiple testing using fdr, where appropriate. Significant differences are indicated by stars (** for P < 0.01; * for P < 0.05). Data from three independent experiments is shown. c In silico growth of MYb11 and MYb71 in mono- and co-culture in sucrose-thiamine medium using BacArena with an arena of 20 × 20 and five initial cells per species. d Bacterial interaction types observed during in silico co-cultures of all combinations of the 77 microbiota isolates and OP50

