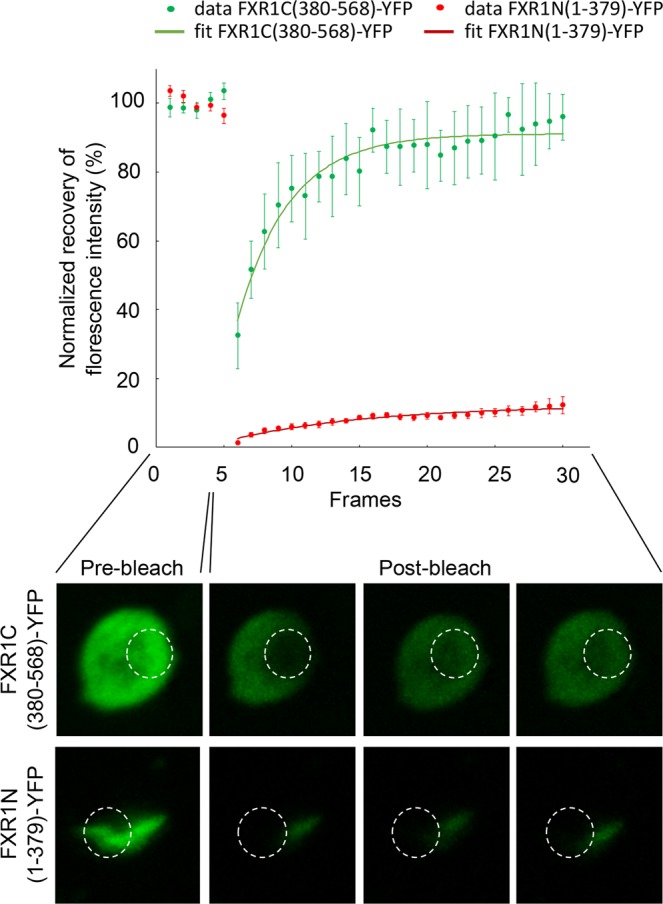
Figure 5.

FRAP microscopy of the chimeric FXR1N(1-379)-YFP and FXR1C(380-568)-YFP proteins in yeast cells. On the graph, normalized fluorescence recoveries (%) for the corresponding proteins and their fits according to a simple monoexponential model are presented. Data are shown as the means ± SEM (sample set n = 5). Images below the graph demonstrate ROIs (white circles) in yeast cells expressing studied proteins before (pre-bleach) and after photobleaching (1st, 15th and 25th post-bleach frames, 25 post-bleach frames in total, time between each frame = 30 sec).
