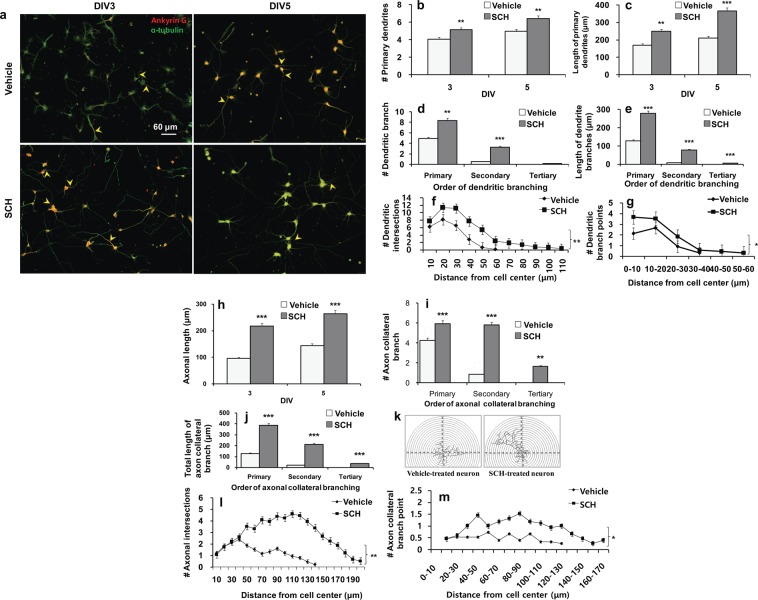
Figure 3.
Effects of SCH on axodendritic morphogenesis in hippocampal neurons. Neurons were grown on the same culture conditions as indicated in Fig. 1 for 3–5 days. Neurons were then fixed and double-immunostained for ankyrin G (red) and α-tubulin (green). Ankyrin G is characteristically concentrated at axon initial segment (AIS; indicated by arrows). Representative fluorescent images from cultures at DIV3 or 5 to visualize the cell morphology. Scale bar, 60 μm, applies to all images (a). Morphometric analysis of DIV3~5 neurons for dendritic development: the number of primary dendrites (b), the length of primary dendrites (c), the number of dendritic branches (d) and the length of dendritic branches (e). Sholl analysis for dendritic intersections (f) and branch points (g) in DIV5 neurons. Morphometric analysis of axonal development: length of axonal shaft (h), axonal collateral branch (i) and the total length of axonal collateral branch (j) in orders. Sholl image with reconstructed neurons, which does not represent any of the experimental data (k). Sholl analysis for axonal intersections (l), and axonal collateral branch points (m). Bars represent the mean ± SEM (n >15 neurons). Data points represent the mean ± SEM (n = 15 neurons). Statistical significance compared to vehicle: *p < 0.05, **p < 0.01 and ***p < 0.001 (Student’s t-test).

