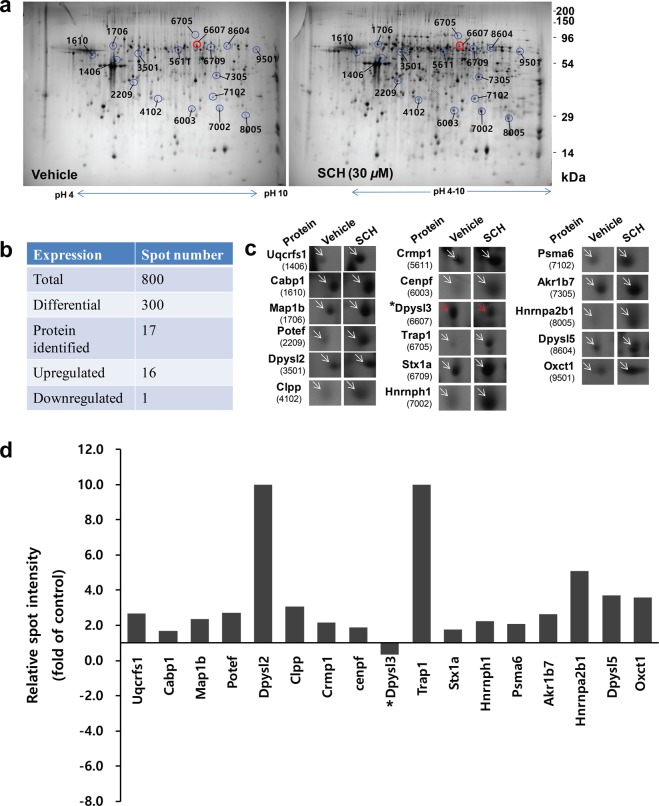
Figure 4.
Proteome changes in SCH-treated neurons. Hippocampal neurons were cultured in the presence of vehicle or SCH (30 μM) for 6 days. Proteins were harvested and identified as described in the Supplementary Methods section. (a) Representative 2-DE images showing differentially expressed protein spots indicated by circles and labeled with numbers, which correspond to those illustrated in Table 1. Red circles indicate downregulated proteins. The pI range is below the gels, and the molecular mass is on the right of the gels. Summary of the protein spots (b). Magnified images of differentially expressed protein spots (c). Intensities of differentially expressed proteins (d). Relative spot intensities were calculated as ratios versus vehicle-treated controls. Asterisks indicate downregulated spots.

