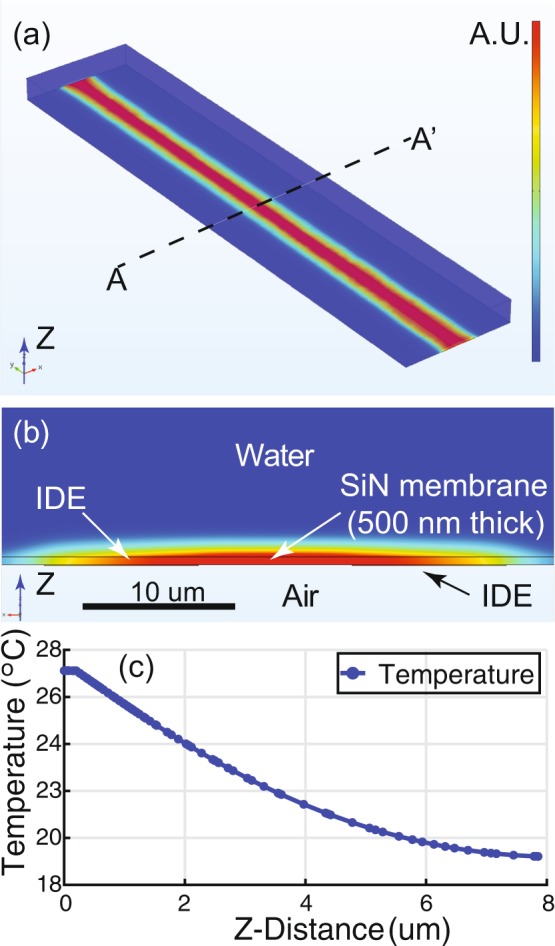
Figure 5.

COMSOL simulation results. As shown in Fig. 3, the numerical analysis agrees with the measured results. (a) A perspective view of the DEP device in Fig. 1(d). The temperature increase between the IDEs is shown. (b) Cross-sectional view along AA’ in (a). The highest temperature increase occurs on the SiN membrane between the IDEs. (c) Temperature profile from the center of the SiN membrane (0 μm) to water in the z-direction.
