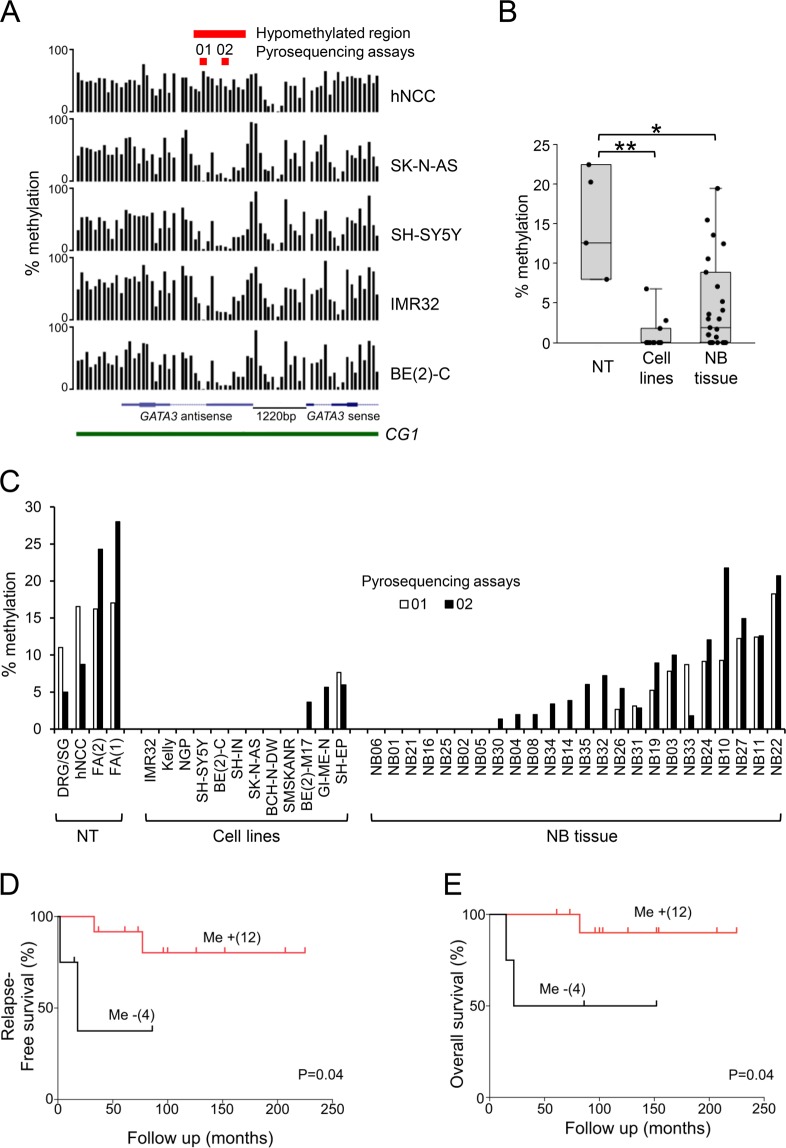
Figure 2.
GATA3 DNA methylation in neuroblastoma. (A) GATA3 DNA methylation detected by MCIP. Black bars show the probe ratios derived from MCIP for hNCC and four neuroblastoma cell lines, positioned on the GATA3 CpG island promoter region, showing the sense and antisense transcripts and CpG island (CGI) (human genome build NCBI36/Hg18 visualised on the UCSC genome browser; http://genome.ucsc.edu). The positions of the hypomethylated region and the two pyrosequencing assays (01 and 02) are shown in red at the top. (B) Dotboxplot of GATA3 antisense DNA methylation measured by pyrosequencing in normal tissues (NT, n = 4), neuroblastoma cell lines (Cell lines, n = 12), and neuroblastoma tumour tissue (NB tissue, n = 24), using the average of pyrosequencing assays 01 and 02; full results in C; *p < 0.05, **p < 0.005, Bonferroni corrected Mann-Whitney test. (C) DNA methylation in the GATA3 antisense region in normal tissues (NT), NB cell lines (Cell lines) and NB tumour tissue (NB tissue), using pyrosequencing assays 01 (unfilled bars) and 02 (filled bars). The genomic positions of assays 01 and 02 are shown in part A. (D,E) Kaplan–Meier survival curves (D, relapse-free survival; E, overall survival) taken from the dataset of NB patients in B and C for whom survival data were available. Me-, tumours with no GATA3 DNA methylation; Me + tumours with DNA methylation (using the average of pyrosequencing assays 01 and 02). p values from log-rank test.

