
Figure 3.
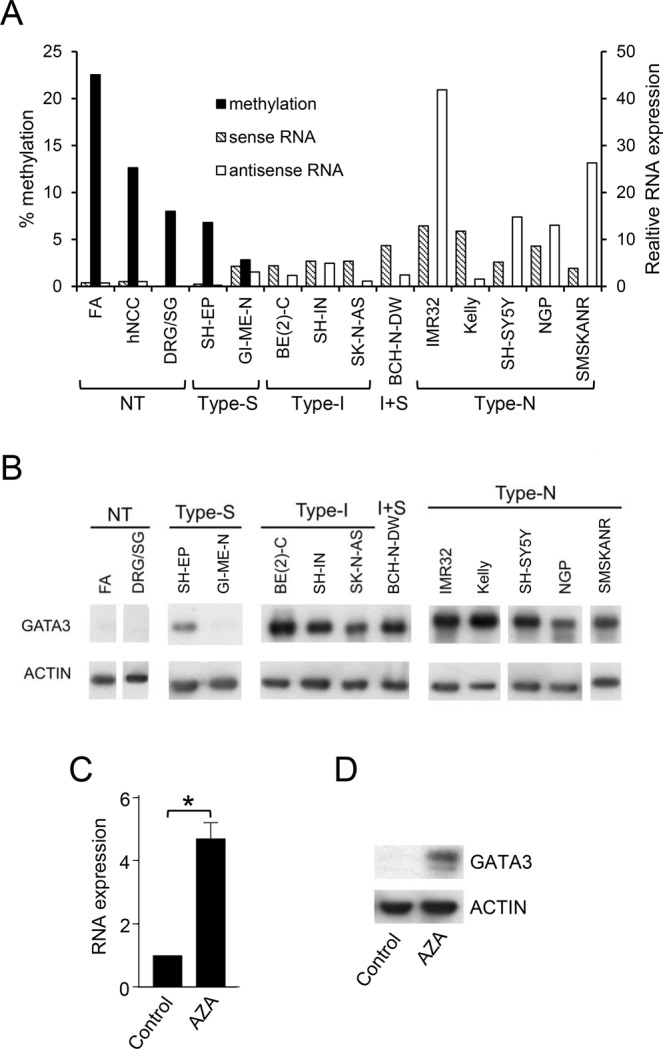
GATA3 DNA methylation and expression. (A) GATA3 sense (hatched bars) and antisense (unfilled bars) RNA expression assayed by QPCR, and DNA methylation levels (black bars) detected by pyrosequencing, in control tissues and neuroblastoma cell lines. RNA levels were normalized to endogenous levels of TBP and expressed relative to hNCC. DNA methylation was calculated as the average of the 01 and 02 pyrosequencing assays. (B) GATA3 protein levels assayed by Western blot in normal tissues (NT) and type-S, type-I, I + S and type-N neuroblastoma cell lines, with ACTIN as a loading control. Uncropped blots are shown in Supplementary Fig. S10. (C) GATA3 sense RNA expression in DRG/SG cells treated with 2 μM AZA for 6 days. RNA levels were normalized to endogenous levels of TBP and expressed relative to control. Mean ± S.E.M of three experiments; *p < 0.05, paired t test. (D) Western Blot of GATA3 protein expression in in DRG/SG cells treated with 2 μM AZA for 6 days, with ACTIN as a loading control. Uncropped blots are shown in Supplementary Fig. S10.