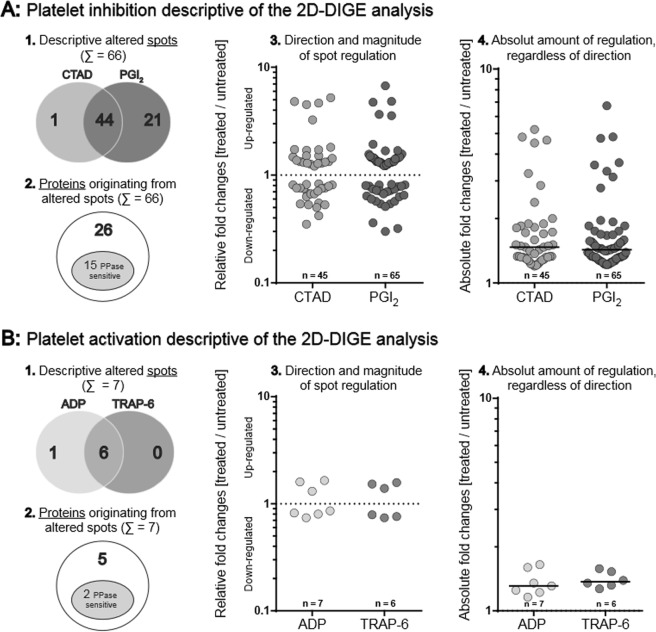
Figure 2.
Quantitative and qualitative platelet proteome changes in response to (A) inhibition (CTAD/PGI2) and (B) activation (ADP/TRAP-6) compared to untreated control. In total, 66 spots for inhibition and 7 spots for activation were significantly altered. These spots were deduced from a total of 5,906 detected protein spots by applying the following criteria: [(a) protein spots matched >90% of all 2D-DIGE gels, (b) protein abundance changes >20% between treatment group (ADP, TRAP-6, CTAD or PGI2) and untreated control and (c) FDR-corrected ANOVA p-value < 0.05]. (1) Absolute numbers of separately and commonly altered protein spots upon inhibition (Σ = 66) and activation (Σ = 7). (2) Altered protein spots upon inhibition (Σ = 66) and activation (Σ = 7), that originated from distinct proteins: in sum, 31 proteins were identified (26-inhibition; 5-activation) of which 17 proteins were sensitive to phosphatase-treatment (15-inhibition; 2-activation) (3) The direction and magnitude of regulation is given for commonly and uniquely altered protein spots of each subgroup: CTAD = 45 (1 unique /44 common), PGI2 = 65 (21/44), ADP = 7 (1/6) and TRAP-6 = 6 (0/6). Relative fold changes [treated vs. untreated] are depicted and compared to the respective control (dashed line y = 1) on a logarithmic scale. (4) The absolute amount (|x|) of altered protein spots, regardless of direction, is represented as positive fold changes [treated vs. untreated] compared to the respective control with its corresponding medians. The median abundance difference was determined by a Mann-Whitney-U test with an α-level set at p < 0.05. PGI2 - prostacyclin, CTAD - citrate, theophylline, adenosine, dipyridamole, ADP - adenosine-diphosphate, TRAP-6 – thrombin receptor-activating peptide-6.

