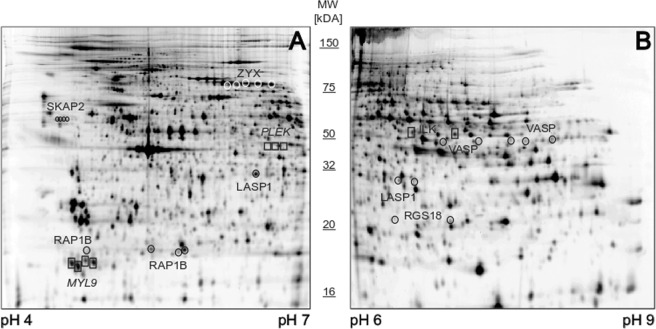
Figure 3.
Representative 2D-DIGE gels pH 4–7 and pH 6–9 with significantly altered platelet proteins upon inhibition and activation are delineated. These exemplary monochrome-displayed 2D-DIGE images show significantly altered platelet protein spots upon inhibition and activation which are discussed in detail in the manuscript. In Supplementary Fig. S2 coloured 2D-DIGE images are displayed. A total of 36 µg (12 µg sample Cy3-, 12 µg sample Cy5-, and 12 µg internal standard Cy2-labeled) platelet protein extracts were separated according to the isoelectric point (pI) and the molecular weight (MW) in the pH ranges (A) pH 4–7 and (B) pH 6–9. Altered proteins were identified by mass spectrometry and are outlined for inhibition and for activation with their respective UniProt “Gene” name. Protein spots of interest were selected according to (a) protein spots matched >90% of all 2D-DIGE gels, (b) protein abundance changes >20% between treatment group and untreated control and (c) FDR-corrected ANOVA p-value <0.05.

