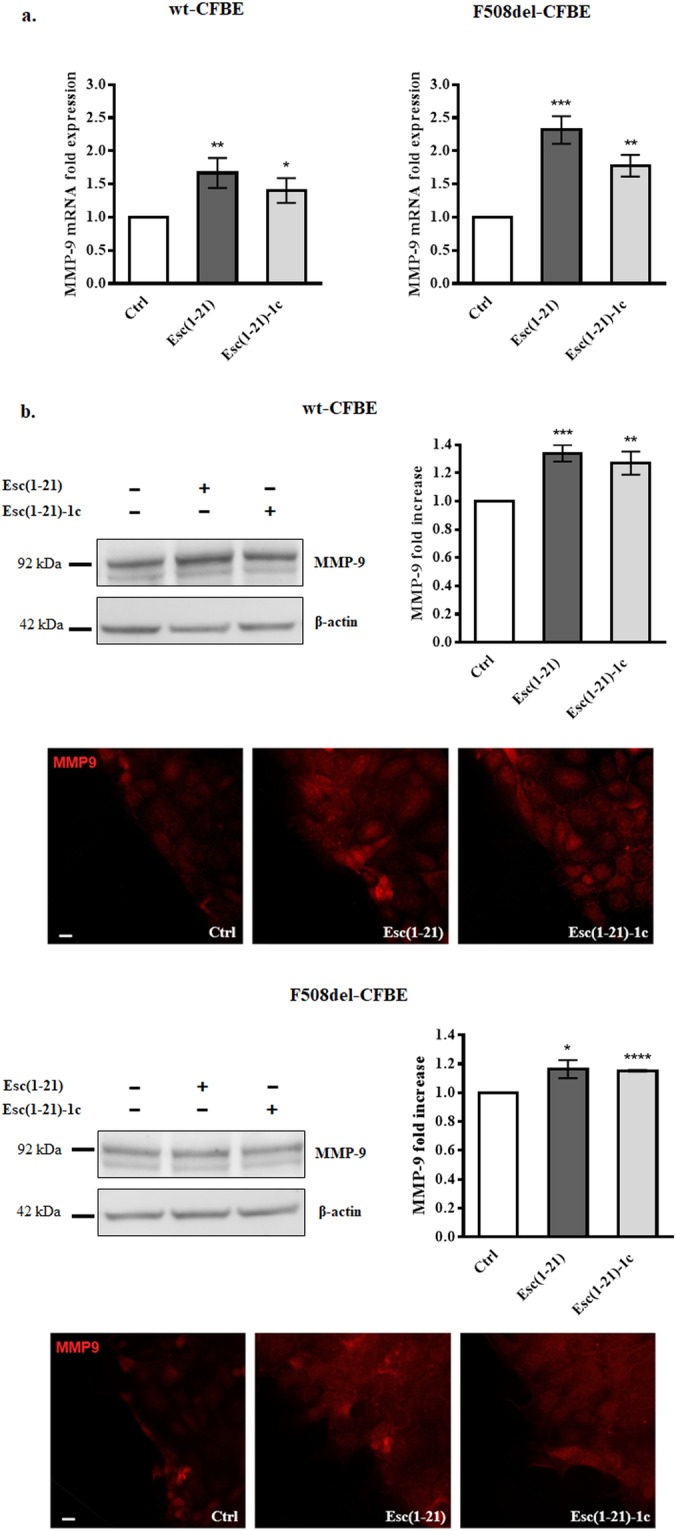
Figure 5.

Panel a: Effect of peptides treatment on MMP-9 mRNA expression in wt-CFBE and F508del-CFBE. 3 × 10⁵ CFBE cells were seeded in 35-mm dish plates and treated with Esc(1–21) at 10 μM or Esc(1–21)-1c at 1 μM for 12 h. Afterwards, cells were lysed and the extracted RNA was analyzed by real-time PCR. Results are expressed as fold increase of MMP-9 expression with respect to the untreated Ctrl and indicate the mean value ± SEM of three independent experiments. Significance levels are defined as P values of <0.05 (*), <0.01 (**) and <0.001 (***) versus the corresponding Ctrl. Panel b: Effect of peptides treatment on MMP-9 protein expression in wt-CFBE and F508del-CFBE. Representative western blots showing the expression of MMP-9 and β-actin in untreated (-) samples or in cells treated with Esc(1–21)/Esc(1–21)-1c, at 10 μM/1 μM, for 12 h (cropped images). Molecular weights of MMP-9 and β-actin are also indicated. Samples showed in the gels derive from the same experiment and were processed in parallel. Full-length images are reported in Supplementary Fig. S1. Histograms indicate the quantitative analysis of MMP-9 measured by densitometry scanning of western blots. Results were normalized and expressed as fold increase with respect to Ctrl and indicate the mean value ± SEM of three independent experiments. Significance levels are defined as P values of <0.05 (*), <0.01 (**), <0.001 (***) and <0.0001 (****) versus the corresponding untreated Ctrl. Representative images of immunofluorescence to evaluate MMP-9 expression are also reported. Cells were stained with MMP-9 antibody as described in Materials and Methods. Scale bars, 20 μm.
