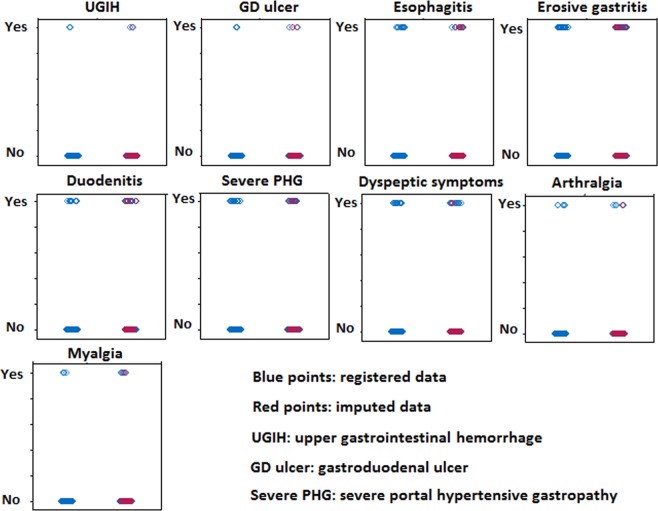
Figure 3.
Multiple imputations performed to attribute values to the subjects who did not complete the study protocol. The imputations had a mean difference of 3.41% between the observed outcomes (blue) and the imputed ones (red). Each adverse event is described in two lines according to its presence (yes or no), and in two columns according to the inclusion or not of imputed data: the left columns show only the results from patients who complete the follow-up, while the right columns show results obtained by combining the observed data and the imputed ones.

