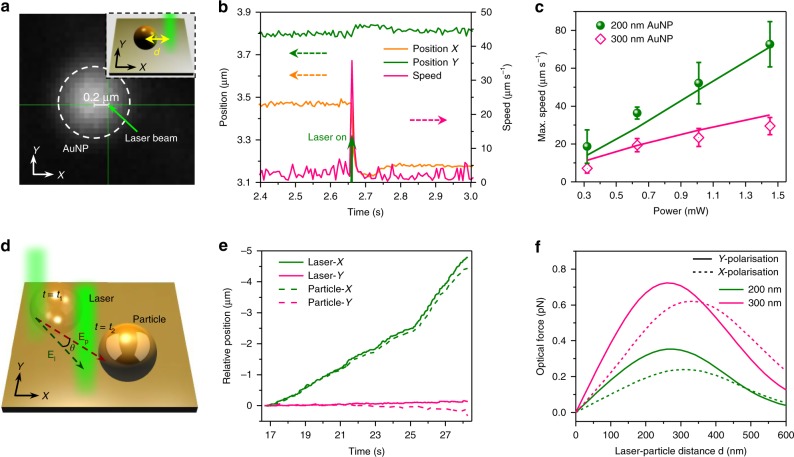
Fig. 2. Characterisation and modelling of the OPN manipulation process.
a Optical image and (inset) the schematic illustration showing the measurement of particle velocities. The distance between the centre of the laser beam and the centre of the particle was set to 200 nm for all measurements. b The measured X position, Y position, and speed v of a 300 nm AuNP under the laser irradiation of 1.40 mW as a function of time t. The solid green arrow at t = ~2.7 s indicates the instant when the laser is turned on. c Measured maximum speed of 200 nm and 300 nm AuNPs as a function of incident power. The solid lines show the corresponding modelled data. d Schematic of the comparison of the laser movement vector El and the particle movement vector Ep at two successive frames (t = t1, t2). θ is denoted as the angle between El and Ep. e Examples of the recorded trajectories of the laser beam and the particle during the manipulation (see Supplementary Movie 1 for the manipulation of the 80 nm AuNP). f The calculated optical scattering forces of 200 nm (olive) and 300 nm (pink) AuNPs as a function of laser-particle distance. Incident power: 1.4 mW. Source data are provided as a Source Data file.

