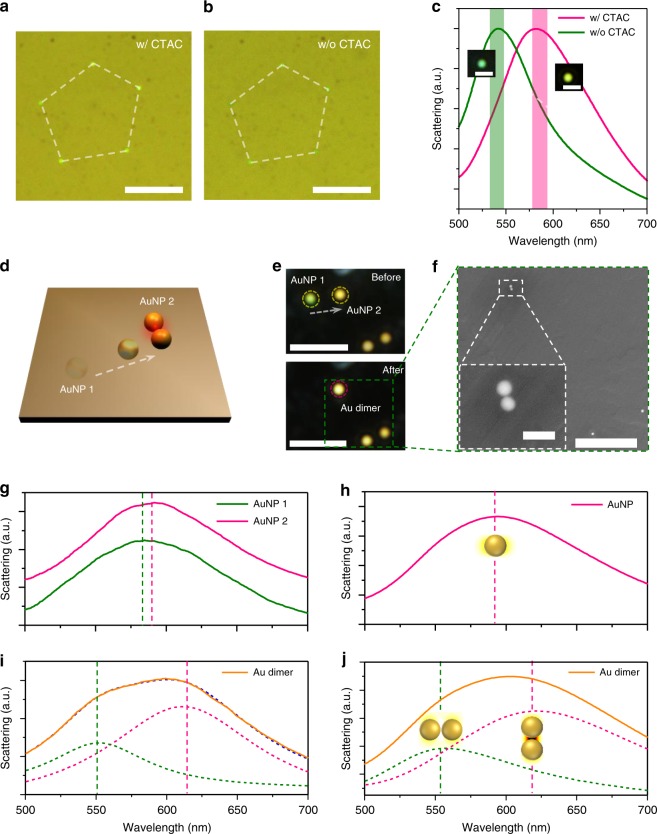
Fig. 5. In situ optical spectroscopy.
a, b Optical images of a pentagon pattern composed of five 100 nm AuNPs a before and b after the removal of CTAC. Two identical white dashed pentagons are added to help indicate the positions of AuNPs. c The scattering spectra of 100 nm AuNPs measured before and after the removal of CTAC. The shaded area indicates the standard deviation of the peak position. The insets show the corresponding dark-field images. d Schematic illustration of the assembly of Au dimer with two 100 nm AuNPs. e Dark-field images of the AuNP before and after the dimer assembly. f SEM image of the Au dimer. g Scattering spectra of the two AuNPs before assembly. h The simulated scattering spectra of a 100 nm AuNP. i Scattering spectra of the Au dimer. The pink and olive dashed curves represent the longitudinal and transverse plasmon modes, respectively. j The simulated scattering spectrum of the AuNP dimer. The insets in h, j show the corresponding electric field enhancement profiles. Scale bars: a, b 10 μm; inset in c 2 μm; e 5 μm; f 2 μm; inset in f 200 nm.

