Figure 5.
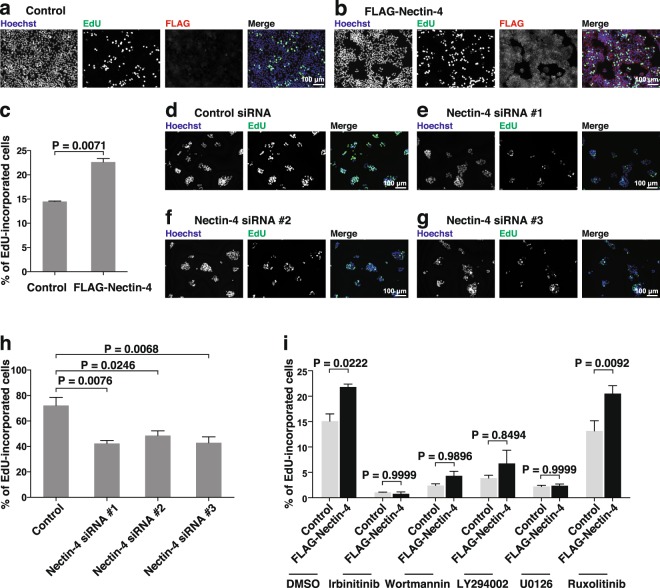
Enhancement of DNA synthesis by nectin-4 through the ErbB2-mediated PI3K-AKT signalling pathway. (a–c) Enhancement of DNA synthesis by nectin-4. T47D control cells (a) or T47D cells stably expressing FLAG-tagged nectin-4 (FLAG-Nectin-4) (b) were serum-starved and treated with medium containing 10 μM EdU for 12 h. After washout of the medium, the cells were cultured in the absence of serum and stained with an anti-DDDDK mAb, Hoechst33342, and EdU staining reagents. The number of EdU-incorporated cells was counted by microscopy and Hybrid Cell Counter software (c). (d–h) Reduction of DNA synthesis by the knockdown of NECTIN4. SUM190-PT cells were transfected with a control siRNA (d) or NECTIN4 siRNAs (e–g), and the number of EdU-incorporated cells was counted by microscopy and Hybrid Cell Counter software (h). The assay was carried out as in (a–c). (i) Reduction of DNA synthesis by ErbB2, PI3K, and MEK inhibitors, but not a JAK inhibitor. T47D cells stably expressing FLAG-Nectin-4 were serum-starved and treated with the ErbB2 inhibitor irbinitinib at 1 μM, the PI3K inhibitor wortmannin at 1 μM or the PI3K inhibitor LY294002 at 50 μM, the MEK inhibitor U0126 at 10 μM, or the JAK1 and JAK2 inhibitor ruxolitinib at 1 μM. The assay was carried out as in (a–c). Bars indicate the means ± S.E. of three independent experiments. The actual P values for each test are shown in each figure. Scale bars, 100 μm. Representative results (images) from three independent experiments are shown.

